NOVEMBER 2016 RE/MAX NATIONAL MARKET UPDATE
November 2016 RE/MAX National Housing Report & Local Market Snapshot
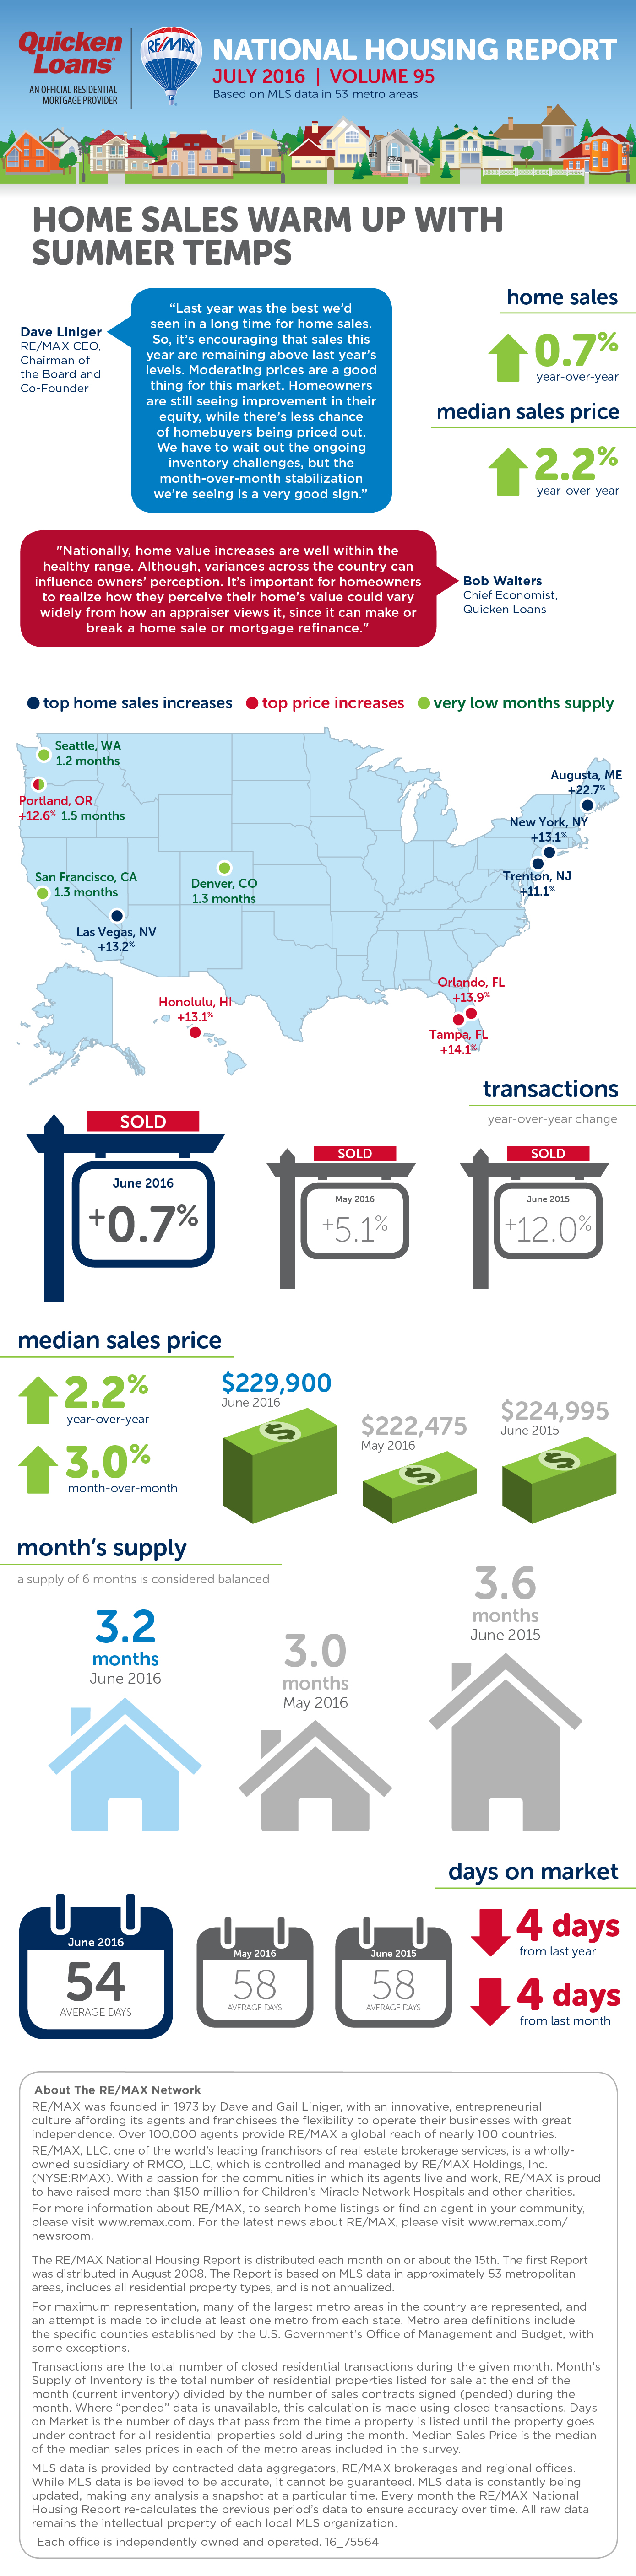
October Sees Near-Record Sales
November 17, 2016
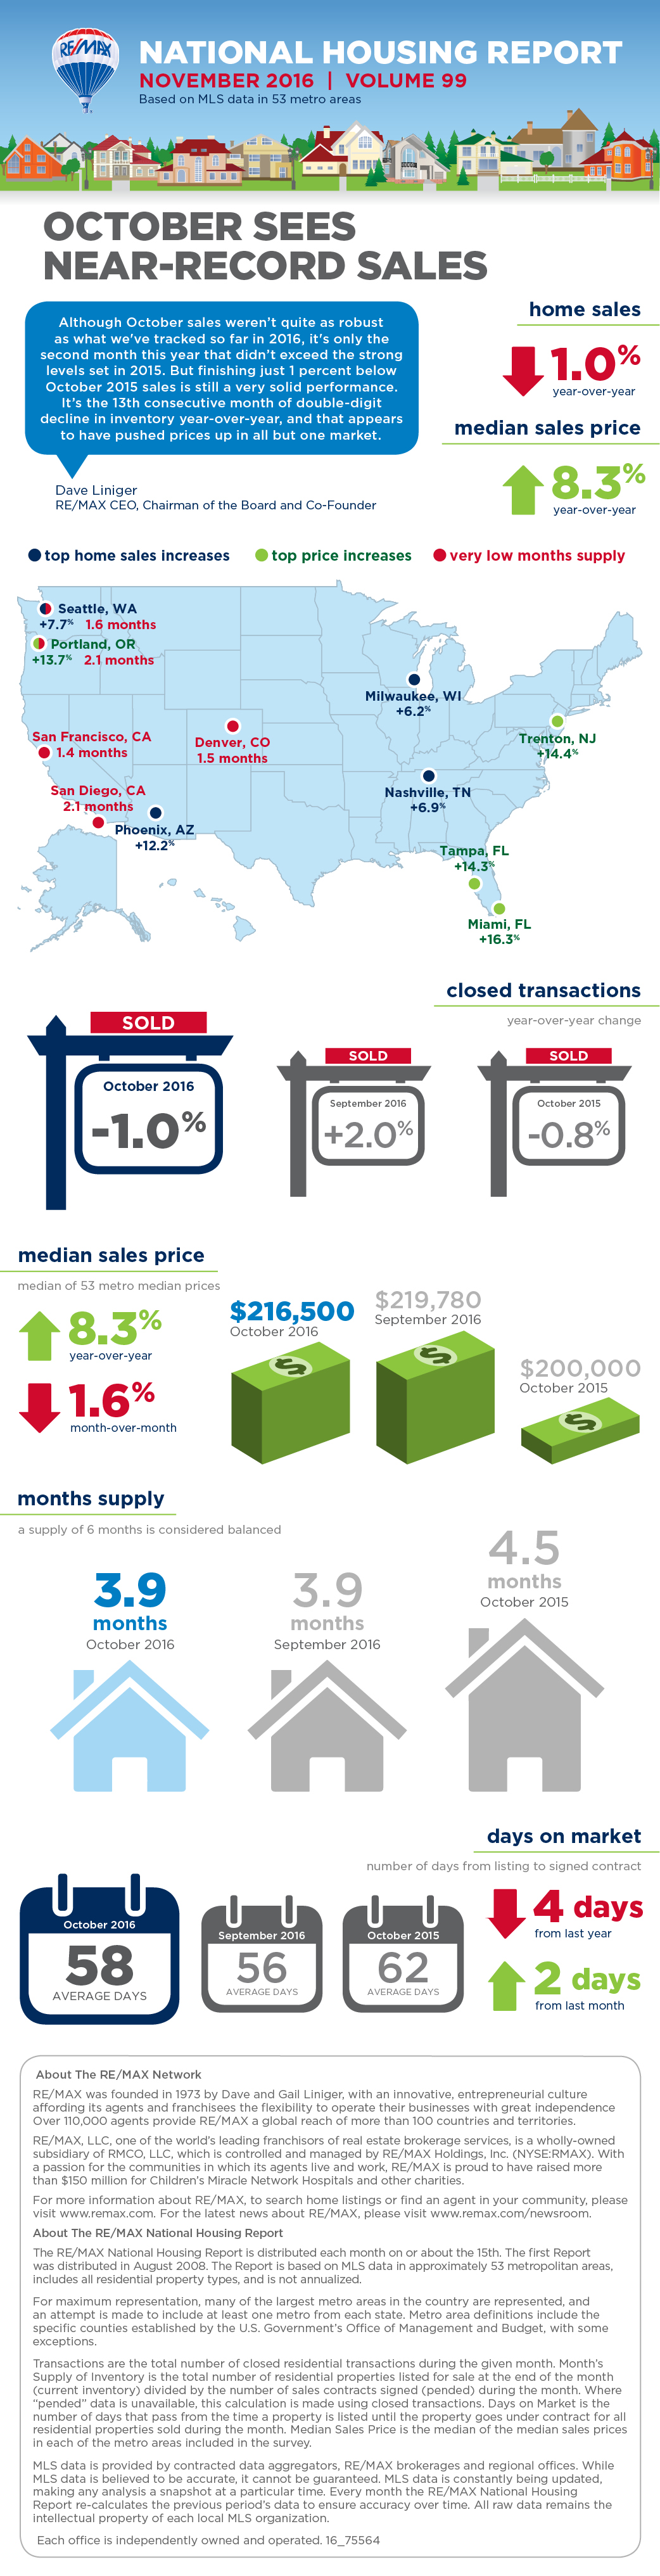
DENVER (Nov. 17, 2016) – Last month saw the second-most sales – and the smallest inventory – of any October in the 9-year history of the RE/MAX National Housing Report. Add to that combination the highest year-over-year price increase of 2016 thus far: 8.3%.
Although posting near-record sales, this October finished 1% below October 2015 sales, which posted the highest of any October dating back to 2008. Sales declined year-over-year in 28 of the 53 markets surveyed, including many New England markets.
The number of homes for sale was the lowest of any month since May, and also the lowest of any October dating back to 2008. Inventory declined in 48 of the 53 markets surveyed. The Months Supply of Inventory was 3.9.
Reflecting strong sales and shrinking inventory, last month’s Median Sales Price increased by 8.3% to $216,500. Fueling the hike were double-digit increases in Florida markets (Miami, Tampa, Orlando) and markets with very low inventory (San Francisco and Denver).
“Although October sales weren’t quite as robust as what we've tracked so far in 2016, it's only the second month this year that didn’t exceed the strong levels set in 2015. But finishing just 1 percent below October 2015 sales is still a very solid performance,” said Dave Liniger, RE/MAX CEO, Chairman of the Board and Co-Founder. “It’s the 13th consecutive month of double-digit decline in inventory year-over-year, and that appears to have pushed prices up in all but one market.”
Albuquerque, NM
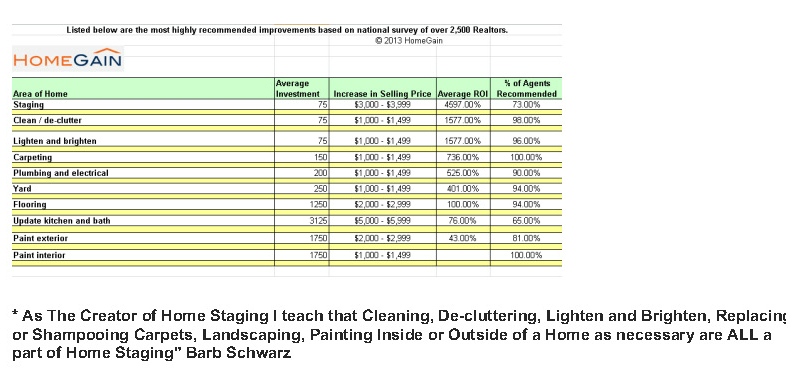
As for the Great Albuquerque Area, Pete Veres wants to report that the median detached price rose 3.3 percent to $189,000, the number of new listings dropped 10.5 percent for single-family detached homes and 6.8 percent for condos, townhomes and other attached homes. Overall inventory of detached homes for sale dropped 17.1 percent in October detached homes sold in an average of 54 days – which is 8.5 percent faster than in October 2015. These are all signs that our market has turned and is improving.
National Closed Transactions
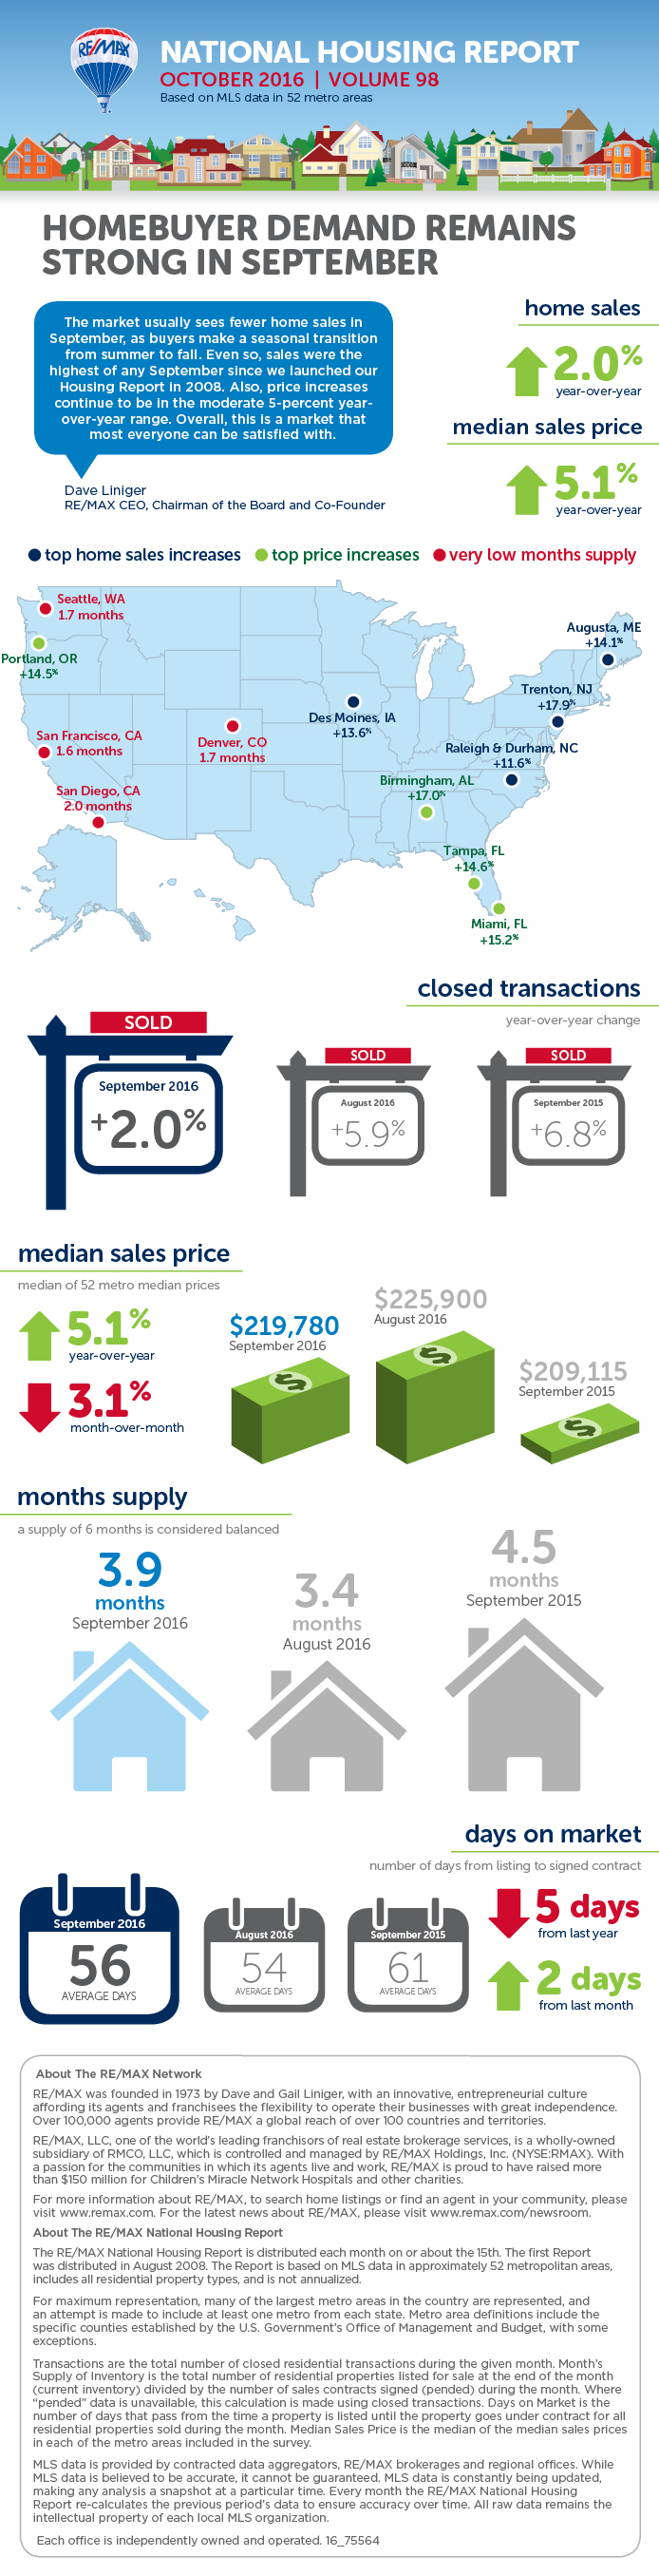
In the 53 metro areas surveyed in October, the average number of home sales decreased by 1.0% compared to one year ago, which marks the second month in 2016 with a decline. Despite a slight decrease in the number of transactions, this October is the second best in the history of the report. This month, less than half of the 53 metro areas surveyed experienced an increase in sales year-over-year with Providence, RI seeing home sales that were unchanged and only one market seeing a double-digit increase. The markets with the largest increase in sales include Phoenix, AZ +12.2%, Seattle, WA +7.7%, Nashville, TN +6.9%, Milwaukee, WI +6.2%, Boise, ID +5.8% and Raleigh & Durham, NC, +4.9%.
Median Sales Price – Median of 53 metro median prices
In October, the median of all 53 metro Median Sales Prices was $216,500, down 1.6% from last month and up 8.3% from October 2015. Of the 53 metro areas surveyed, all but one (Billings, MT) saw year-over-year increases with respect to Median Sales Price, with 14 rising by double-digit percentages. The largest double-digit increases were seen in Miami, FL +16.3%, Trenton, NJ +14.4%, Tampa, FL +14.3%, Portland, OR +13.7% and Orlando, FL +13.7%.
Days on Market – Average of 53 metro areas
The average Days on Market for homes sold in October was 58, up two days from the average in September 2016, but down four days from October 2015. October becomes the 43rd consecutive month with a Days on Market average of 80 or less. Similar to the past two months, the two metro areas with the lowest Days on Market are Omaha and Denver at 28 and 29 respectively. The highest Days on Market averages continue to be in Augusta, ME at 143, and Burlington, VT at 99. Days on Market is the number of days between when a home is first listed in an MLS and a sales contract is signed.
Months Supply of Inventory – Average of 53 metro areas
The number of homes for sale in October was down 6.7% from September, and down 15.9% from October 2015. Based on the rate of home sales in October, the Months Supply of Inventory was 3.9, compared to last month at 3.9 and last year at 4.5. A 6.0-month supply indicates a market balanced equally between buyers and sellers. This month, only five metro areas reported a balanced market at 6.0 or above. The markets with the lowest Months Supply of Inventory are San Francisco, CA 1.4, Denver, CO at 1.5 and Seattle, WA 1.6.
As for the Great Albuquerque Area, Pete Veres wants to report that the median detached price rose 3.3 percent to $189,000, the number of new listings dropped 10.5 percent for single-family detached homes and 6.8 percent for condos, townhomes and other attached homes. Overall inventory of detached homes for sale dropped 17.1 percent in October detached homes sold in an average of 54 days – which is 8.5 percent faster than in October 2015. These are all signs that our market has turned and is improving.