Real Estate Information Archive

Blog

Displaying blog entries 31-40 of 70

RE/MAX National Housing Report for July 2019

by Elite Asset Management Team

Home Sales Increase 2.4% in July, Ending Nine Months of Inventory Growth 


DENVER  July home sales bounced back after a sluggish June by increasing 2.4% year over year, according to the RE/MAX National Housing Report. This was enough to end nine months of year-over-year inventory growth as the number of homes for sale declined 1.4%.

A drop in home sales from June to July is typical in the report's 53 metro areas. But the 0.2% decline from June to July 2019 was by far the smallest month-over-month decline since July 2013. And while June sales failed to top May for only the second time in the report's 10-year history, July sales set a report record for the month.

"July sales snapped back after a tepid June, as attractive low interest rates appear to have brought more buyers into the mix," said RE/MAX CEO Adam Contos. "The housing market has been a bit uneven since the early spring, with each encouraging month seemingly followed by one with lukewarm results. It's possible the housing market has finally shaken some mud off its boots and can maintain its momentum for the back half of the year. If the broader macro environment hangs on, we could see a potentially strong finish to 2019."

July's Median Sales Price of $273,000 - while down slightly from June's all-time report record high - was 9.2% higher than July of 2018. It marked the seventh consecutive month of year-over-year price growth. Home prices have risen, year over year, in 88 of the last 90 months dating back to February 2012. Said Contos, "Although lower interest rates help affordability, we have now seen two straight months of accelerating price increases. If the trend continues, it's not an encouraging development for buyers."

July's Days on Market total of 43 saw sales closing at the same rate as they did in June, but taking two days longer than in July 2018. Months of Inventory in July 2019 totaled 2.7, down compared to June's 2.9 and 3.3 in July 2018.

Closed Transactions 
Of the 53 metro areas surveyed in July 2019, the overall average number of home sales is down 0.2% compared toJune 2019, and up 2.4% compared to July 2018. Leading the month-over-month sales percentage increase wereHonolulu, HI at +11.8%, Anchorage, AK at +10.2%, and New York, NY at +9.2%.

Median Sales Price – Median of 53 metro median prices
In July 2019, the median of all 53 metro Median Sales Prices was $273,000, down 0.7% from June 2019, and up 9.2% from July 2018. Three metro areas saw a year-over-year decrease in Median Sales Price including Anchorage, AK at -3.2%, Trenton, NJ at -2.1%, and San Francisco, CA at -2.0%. Five metro areas increased year-over-year by double-digit percentages, with the largest increases seen in Wichita, KS at +16.7%, Cleveland, OH at +12.9%, and Cincinnati, OH at +11.7%.

Days on Market – Average of 53 metro areas 
The average Days on Market for homes sold in July 2019 was 43, equivalent to the average in June 2019, and up two days from the July 2018 average. The metro areas with the lowest Days on Market were Omaha, NE at 21, Manchester, NH at 24, and Cincinnati, OH at 26. The highest Days on Market averages were in Augusta, ME at 87, Miami, FL at 82, and Hartford, CT at 72. Days on Market is the number of days between when a home is first listed in an MLS and a sales contract is signed.

Months Supply of Inventory – Average of 53 metro areas 
The number of homes for sale in July 2019 was down 2.2% from June 2019 and down 1.4% from July 2018. Based on the rate of home sales in July 2019, the Months Supply of Inventory decreased to 2.7 compared to 2.9 in June 2019, and decreased compared to 3.3 in July 2018. A six months supply indicates a market balanced equally between buyers and sellers. In July 2019, of the 53 metro areas surveyed, only Miami, FL at 6.8 reported a months supply at or over six, which is typically considered a buyer's market. The markets with the lowest Months Supply of Inventory were Phoenix, AZ and Boise, ID, both at 1.5.


Feel free to contact me and I can help break down exactly what these numbers mean for our local market and for your neighborhood. And lastly, If you or anyone you know is thinking of buying or selling a home - please call or email me. I'm here to help!

Peter Veres

Associate Broker,CRS,ABR,CLHMS,SRES

Elite Asset Management Team - RE/MAX Elite

www.PeteVeres.com

Cell: 505-362-2005

RE/MAX National Housing Report for June 2019

by Elite Asset Management Team

June Sales Post Unusual Decline as Median Price Reaches All-Time High


DENVER – Typically the strongest month for home sales, June saw closings decline 4.7% from May and 7.8% from June 2018, according to the RE/MAX National Housing Report. Going in the opposite direction, June’s Median Sales Price of $276,000 was an all-time high in the 10-year history of the report.
 
June has recorded the most sales each of the last five years (July led 2013 sales). This is only the second June in report history to have fewer sales than May. With sales slowing, June inventory increased 1.3% over June 2018, marking the first year-over-year rise in June inventory in the report’s history. Moreover, inventory grew for the ninth consecutive month, and the report’s 54 metro areas had the most units for sale since August 2016.
 
“Record prices appear to have kept June sales figures from topping a strong May,” said RE/MAX CEO Adam Contos. “Nevertheless, there are indications, including the return of very favorable mortgage rates, that the pace could pick up in July. Several encouraging longer-term trends—ongoing demand, improving inventory levels, low interest rates—are helping the market make incremental progress on multiple fronts. But supply remains a concern, so we need more homes to be built.”

Starting in 2013, June has also produced the highest Median Sales Price of each year. June’s record $276,000 was 6.7% higher than the $259,000 recorded in June 2018.  June’s price increase accelerated compared to the prior three months, each of which had a year-over-price increase of less than 3.5%. Contos continued, “The jump in sales price after months of moderation is worth watching for its impact on affordability.”
 
June’s Days on Market total of 44 meant that sales happened three days faster than in May but took three days longer than June 2018. Months of Inventory in June 2019 was 2.8, the same as May’s and below June 2018’s 3.1.
 
Closed Transactions 
Of the 54 metro areas surveyed in June 2019, the overall average number of home sales is down 4.7% compared to May 2019, and down 7.8% compared to June 2018. Leading the month-over-month sales percentage increase were Burlington, VT at +21.8%; Boston, MA at +13.4%; and Hartford, CT at +13.1%.
 
Median Sales Price – Median of 54 metro median prices
In June 2019, the median of all 54 metro Median Sales Prices was $276,000, up 6.2% from May 2019, and up 6.7% from June 2018. Two metro areas saw a year-over-year decrease in Median Sales Price: San Francisco, CA at -2.0%, and Hartford, CT at -0.1%. Three metro areas increased year-over-year by double-digit percentages, with Boise, ID at +10.7%; Albuquerque, NM at +10.4%; and Philadelphia, PA at +10.0%.
 
Days on Market – Average of 54 metro areas
The average Days on Market for homes sold in June 2019 was 44, down three days from the average in May 2019, and up three days from the June 2018 average. The metro areas with the lowest Days on Market were Omaha, NE at 22; Denver, CO at 25; and Seattle, WA at 26. The highest Days on Market averages were in Augusta, ME at 108; Miami, FL at 82; and Hartford, CT at 74. Days on Market is the number of days between when a home is first listed in an MLS and a sales contract is signed.
 
Months Supply of Inventory – Average of 54 metro areas
The number of homes for sale in June 2019 was down 0.6% from May 2019 and up 1.3% from June 2018. Based on the rate of home sales in June 2019, the Months Supply of Inventory held steady at 2.8 from May 2019, and decreased compared to 3.1 in June 2018. A six months supply indicates a market balanced equally between buyers and sellers. In June 2019, of the 54 metro areas surveyed, only Miami, FL at 7.0 reported a months supply at or over six, which is typically considered a buyer’s market. The markets with the lowest Months Supply of Inventory were Omaha, NE and Manchester, NH, both at 1.0, and Minneapolis, MN at 1.8.

Feel free to contact me and I can help break down exactly what these numbers mean for our local market and for your neighborhood. And lastly, If you or anyone you know is thinking of buying or selling a home - please call or email me. I'm here to help!

Peter Veres

Associate Broker,CRS,ABR,CLHMS,SRES

Elite Asset Management Team - RE/MAX Elite

www.PeteVeres.com

Cell: 505-362-2005

RE/MAX National Housing Report for May 2019

by Elite Asset Management Team

Home Sales Accelerate While Inventory Hits 34-Month High


DENVER – May home sales ticked slightly higher year-over-year, ending a 9-month streak of declines, according to the RE/MAX National Housing Report. At the same time, inventory grew for the eighth consecutive month, representing the most units for sale since August 2016 in the report’s 54 metro areas.
 
Homes sold quickly, as evident in the Days on Market average of 47 – the second-fastest May average in the 10-year history of the report. And home sales increased 15.3% from April to May – the second-highest April-May jump in report history.
 
Home sales were up 0.4% over May 2018 - the first year-over-year gain since July 2018. The number of homes for sale increased 4.9% year-over-year to set a report record for the highest May growth. However, based on the pace of home sales, May’s 2.6 Months of Inventory was down compared to April’s 2.8 months and the 2.9 months of May 2018.
 
The Median Sales Price of $259,500 was up 3.4% year-over-year, representing the lowest May increase since 2011.
 
“The spring selling season was in full bloom during the month of May, offering both buyers and sellers something to like,” said RE/MAX CEO Adam Contos. “Buyers are generally finding increased selection along with moderating price increases.  At the same time, in general, sellers are selling their homes quickly while still enjoying some price gains. Bottom line, the market is operating efficiently right now, and homes are selling, on average, at a good clip.”
 
Closed Transactions 
Of the 54 metro areas surveyed in May 2019, the overall average number of home sales is up 15.3% compared to April 2019, and up 0.4% compared to May 2018. Leading the month-over-month sales increase were Billings, MT at +64.2%, Burlington, VT at +61.6%, and Minneapolis, MN at +35.8%.
 
Median Sales Price – Median of 54 metro median prices
In May 2019, the median of all 54 metro Median Sales Prices was $259,500, up 3.3% from April 2019, and up 3.4% from May 2018. Three metro areas saw a year-over-year decrease in Median Sales Price: San Francisco, CA at -5.1%, Honolulu, HI at -3.2%, and Billings, MT at  -1.6%. Three metro areas increased year-over-year by double-digit percentages: Milwaukee, WI at +14.2%, Boise, ID at +13.6%, and Albuquerque, NM at +10.2%.
 
Days on Market – Average of 54 metro areas
The average Days on Market for homes sold in May 2019 was 47, down five days from the average in April 2019, and up two days from the May 2018 average. The metro areas with the lowest Days on Market were Omaha, NE at 25, and San Francisco, CA and Denver, CO, both at 26. The highest Days on Market averages were in Augusta, ME at 106, Miami, FL at 87, and Hartford, CT at 84. Days on Market is the number of days between when a home is first listed in an MLS and a sales contract is signed.
 
Months Supply of Inventory – Average of 54 metro areas
The number of homes for sale in May 2019 was up 4.5% from April 2019 and up 4.9% from May 2018. Based on the rate of home sales in May 2019, the Months Supply of Inventory decreased to 2.6 from 2.8 in April 2019, and decreased compared to 2.9 in May 2018. A six months supply indicates a market balanced equally between buyers and sellers. In May 2019, of the 54 metro areas surveyed, only Miami, FL at 6.2 reported a months supply at or over six. The markets with the lowest Months Supply of Inventory were Boise, ID at 1.2, Omaha, NE at 1.3, and Manchester, NH and San Francisco, CA, both at 1.4.

Feel free to contact me and I can help break down exactly what these numbers mean for our local market and for your neighborhood. And lastly, If you or anyone you know is thinking of buying or selling a home - please call or email me. I'm here to help!

Peter Veres

Associate Broker,CRS,ABR,CLHMS,SRES

Elite Asset Management Team - RE/MAX Elite

www.PeteVeres.com

Cell: 505-362-2005


RE/MAX National Housing Report for April 2019

by Elite Asset Management Team

Spring Home Sales Back on Pace as Price Increases Moderate


DENVER – April home sales finished just 1.1% below a year ago as selling times shortened and tight inventory held steady, according to the RE/MAX National Housing Report. Meanwhile, April’s median home price of $251,000 in the report’s 54 markets was up a mere 2.1% - the smallest year-over-year April increase in eight years.
 
April’s year-over-year sales decline of 1.1% marked the ninth consecutive month of year-over-year decreases, but April’s sales dip was the smallest during that time. At the same time, inventory increased 4.8% and marked the seventh consecutive month of year-over-year growth in number of homes for sale.
 
Compared to March, home sales in April sped up by a full week, taking an average of 52 days instead of 59. The average in April 2018 was 51 days. The Months Supply of Inventory in April decreased year-over-year from 3.0 to 2.6.
 
While the March-over-February increase in home sales of 28.8% was the smallest in five years, the April-over-March increase of 11.2% was an April-over-March record for the 10-year history of the report.
 
“April’s home sales blossomed, suggesting the typical seasonal jump in spring sales arrived later than usual this year,” said RE/MAX CEO Adam Contos. “Solid buyer interest and sellers with realistic price expectations advanced the market’s march toward equilibrium last month. That said, inventory remains constricted, and prices continue to climb, albeit at a slower rate. All in all, April’s results were encouraging, and we continue to be cautiously optimistic about the prospects of a healthy spring selling season.” 
 
Closed Transactions 
Of the 54 metro areas surveyed in April 2019, the overall average number of home sales is up 11.2% compared to March 2019, and down 1.1% compared to April 2018. Leading the month-over-month sales percentage increase were Augusta, ME, at +30.4%, Des Moines, IA, at +23.6%, and Milwaukee, WI, at +22.9%.
 
Median Sales Price – Median of 54 metro median prices
In April 2019, the median of all 54 metro Median Sales Prices was $251,000, up 2.1% from March 2019, and up 2.1% from April 2018. Three metro areas saw a year-over-year decrease in Median Sales Price: San Francisco, CA, at -1.4%, Seattle, WA, at -1.0%, and Anchorage, AK, at -0.3%. Four metro areas increased year-over-year by double-digit percentages, with the largest gains in Boise, ID, at +14.8% and Birmingham, AL, at +13.8%.
 
Days on Market – Average of 54 metro areas
The average Days on Market for homes sold in April 2019 was 52, down seven days from the average in March 2019, and up one day from the April 2018 average. The metro areas with the lowest Days on Market were Omaha, NE, at 27, and Denver, CO, and San Francisco, CA, both at 30. The highest Days on Market averages were in Augusta, ME, at 116, Hartford, CT, at 89, and Miami, FL, at 86. Days on Market is the number of days between when a home is first listed in an MLS and a sales contract is signed.
 
Months Supply of Inventory – Average of 54 metro areas
The number of homes for sale in April 2019 was up 3.3% from March 2019 and up 4.8% from April 2018. Based on the rate of home sales in April 2019, the Months Supply of Inventory decreased to 2.6 from 2.9 in March 2019, and decreased compared to 3.0 in April 2018. A six months supply indicates a market balanced equally between buyers and sellers. In April 2019, of the 54 metro areas surveyed, only Miami, FL, at 6.3 reported a months supply at or over six, which is typically considered a buyer’s market. The markets with the lowest Months Supply of Inventory were Boise, ID, Denver, CO, Manchester, NH, and Omaha, NE, all at 1.2.

Feel free to contact me and I can help break down exactly what these numbers mean for our local market and for your neighborhood. And lastly, If you or anyone you know is thinking of buying or selling a home - please call or email me. I'm here to help!

Peter Veres

Associate Broker,CRS,ABR,CLHMS,SRES

Elite Asset Management Team - RE/MAX Elite

www.PeteVeres.com

Cell: 505-362-2005


RE/MAX National Housing Report for March 2019

by Elite Asset Management Team

March Sales Signal Slowest Start to Spring Homebuying Since 2014


DENVER – Kicking off the spring homebuying season, March sales climbed almost 29% over February, according to the RE/MAX National Housing Report. But this remains the slowest start in five years, with March sales 8.6% lower than March 2018.
 
March was the eighth consecutive month of year-over-year sales declines and the sixth straight month of year-over-year inventory growth, with a 5.3% gain. Housing activity in the report’s 54 markets nationwide also saw the Median Sales price grow by 3.4% year-over-year – notably smaller than the year-over-year increases in February (5.5%) and January (4.6%).  However, the median sales price has risen by more than 3% year-over-year in 17 of the last 18 months.
 
From 2015 to 2018, the housing market’s spring sprang to life with an increase in sales from February to March averaging 37.0%. March 2019’s month-over-month increase of 28.8% was the smallest since 24.6% in 2014.
 
Days on Market increased to 59 from 57 last March, while Months Supply of Inventory declined year-over-year to 2.7 from 3.0.
 
“It was encouraging to see month-over-month sales improve during March,” said RE/MAX CEO Adam Contos. “Although the seasonal bounce that typically ends the first quarter wasn’t as strong as in the past few years, conditions are in place for a healthy spring selling season. Falling interest rates, rising inventory and moderating price increases against the backdrop of a healthy overall economy are cause for optimism for buyers and sellers alike.”
 
Closed Transactions 
Of the 54 metro areas surveyed in March 2019, the overall average number of home sales is up
28.8% compared to February 2019, and down 8.6% compared to March 2018. Leading the month-over-month sales percentage increase were Burlington, VT, at +48.3%, Wichita, KS, at +46.8%, and San Francisco, CA, at +44.3%.
 
Median Sales Price – Median of 54 metro median prices
In March 2019, the median of all 54 metro Median Sales Prices was $246,000, up 2.5% from February 2019, and up 3.4% from March 2018. Two metro areas saw a year-over-year decrease in Median Sales Price:  San Francisco, CA, at -3.8% and Hartford, CT, at -1.4%. Three metro areas increased year-over-year by double-digit percentages – Manchester, NH, at +12.2%, Omaha, NE, at +11.8%, and Wichita, KS, at +10.7%.
 
Days on Market – Average of 54 metro areas
The average Days on Market for homes sold in March 2019 was 59, down three days from the average in February 2019, and up two days from the March 2018 average. The metro areas with the lowest Days on Market were Omaha, NE, and San Francisco, CA, both at 31, and Denver, CO, at 35. The highest Days on Market averages were in Augusta, ME, at 122, and Burlington, VT, and Hartford, CT, both at 97. Days on Market is the number of days between when a home is first listed in an MLS and a sales contract is signed.
 
Months Supply of Inventory – Average of 54 metro areas
The number of homes for sale in March 2019 was up 0.3% from February 2019 and up 5.3% from March 2018. Based on the rate of home sales in March 2019, the Months Supply of Inventory decreased to 2.7 from 3.7 in February 2019, and from 3.0 in March 2018. A six-months supply indicates a market balanced equally between buyers and sellers. In March 2019, of the 54 metro areas surveyed, only Miami, FL, at 6.5 reported a supply at or over six months, which is typically considered a buyer’s market. The markets with the lowest Months Supply of Inventory were Denver, CO, at 1.2, and four metros at 1.3 – San Francisco, CA, Seattle, WA, Boise, ID, and Manchester, NH.


Feel free to contact me and I can help break down exactly what these numbers mean for our local market and for your neighborhood. And lastly, If you or anyone you know is thinking of buying or selling a home - please call or email me. I'm here to help!

Peter Veres

Associate Broker,CRS,ABR,CLHMS,SRES

Elite Asset Management Team - RE/MAX Elite

www.PeteVeres.com

Cell: 505-362-2005


RE/MAX National Housing Report for February 2019

by Elite Asset Management Team


Declining Sales, Growing Inventory Continue to Move in Direction of Buyer’s Market


DENVER – Riding two trends—declining sales and growing inventory— the U.S. housing market continued to transition from a seller’s market to a buyer’s market in February, according to the RE/MAX National Housing Report.
 
Home sales in the 54-market report have declined year-over-year for seven consecutive months, though February’s downturn of 4.2% was the smallest since the 1.1% drop that started the streak in August 2018. At the same time, inventory grew 5.8% over February of 2018, marking the fifth consecutive month of growth following a decade-long trend of shrinking inventory. The Months Supply of Inventory also grew in February from 3.1 in 2018 to 3.4 this year.
 
Bucking these trends, the Median Sales Price increased to $240,000, a year-over-year gain of 5.5% and a February record in the 10-year history of the report. That followed January’s upturn of 4.6%.
 
Days on Market totaled 63—one day more than February 2018 and four days more than January 2019.
 
“Trends of five months or more often indicate significant shifts, and the year-over-year trends in declining sales and rising inventory have both reached that length now,” said RE/MAX CEO Adam Contos. “It’s interesting to see the slowing sales and growing inventories that benefit buyers and at the same time the record prices that benefit sellers. The big picture supports an ongoing return to more balanced conditions.”  
 
“The next few months will determine whether the shift brings a wave of buyers into the market for the spring selling season. Members of our network are reporting high local demand along with a need for even more inventory. The optimism for a solid spring exists – and a more balanced market certainly contributes to it.”
 
Closed Transactions
Of the 54 metro areas surveyed in February 2019, the overall average number of home sales is up
10.2% compared to January 2019, and down 4.2% compared to February 2018. Leading the month-over-month sales percentage increase were Houston, TX at +28.8%, Birmingham, AL at +26.7%, and Raleigh-Durham, NC at 26.5%.
 
Median Sales Price – Median of 54 metro median prices
In February 2019, the median of all 54 metro Median Sales Prices was $240,000, up 2.2% from January 2019, and up 5.5% from February 2018. Nine metro areas saw a year-over-year decrease in Median Sales Price including Birmingham, AL at -4.2%, Hartford, CT at -4.0%, and Anchorage, AK at -3.9%. Four metro areas increased year-over-year by double-digit percentages, with the largest increases seen in Boise, ID at +16.0%, Cincinnati, OH at +13.2%, and Wilmington/Dover, DE at +12.6%.
 
Days on Market – Average of 54 metro areas
The average Days on Market for homes sold in February 2019 was 63, up four days from the average in January 2019, and up 1 day from the February 2018 average. The metro areas with the lowest Days on Market were Omaha, NE at 34, San Francisco, CA at 37, and a two-way tie between Denver, CO and San Diego, CA at 42. The highest Days on Market averages were in Augusta, ME at 120, Trenton, NJ at 113, and Hartford, CT at 96. Days on Market is the number of days between when a home is first listed in an MLS and a sales contract is signed.
 
Months Supply of Inventory – Average of 54 metro areas
The number of homes for sale in February 2019 was down 1.4% from January 2019 and up 5.8% from February 2018. Based on the rate of home sales in February 2019, the Months Supply of Inventory decreased to 3.4 from 3.9 in January 2019, and increased compared to 3.1 in February 2018. A six months supply indicates a market balanced equally between buyers and sellers. In February 2019, five of the 54 metro areas surveyed reported a months supply at or over six months, including Miami, FL at 7.6 and Indianapolis, IN at 7.4, which is typically considered a buyer’s market. The markets with the lowest Months Supply of Inventory were Denver, CO at 1.4 and San Francisco, CA at 1.6.


Feel free to contact me and I can help break down exactly what these numbers mean for our local market and for your neighborhood. And lastly, If you or anyone you know is thinking of buying or selling a home - please call or email me. I'm here to help!


Peter Veres

Associate Broker,CRS,ABR,CLHMS,SRES

Elite Asset Management Team - RE/MAX Elite

www.PeteVeres.com

Cell: 505-362-2005

RE/MAX National Housing Report for January 2019

by Elite Asset Management Team

Housing Inventory Posts Record Increase as Declining Sales Extend to Sixth Month


DENVER – A sixth consecutive month of declining home sales in January contributed to the largest year-over-year inventory increase in at least 10 years, according to the RE/MAX National Housing Report.
 
While year-over-year home sales dropped 11% – extending a streak that began in August – inventory grew year-over-year by an average of 6.4% across the report’s 54 U.S. metro areas. January marked the fourth consecutive month of year-over-year inventory growth – further reversing a decade-long trend of shrinking inventory. December 2018’s year-over-year inventory growth of 4.7% was the previous record in the report’s 10-year history.
 
“The winter chill extended to the housing market in January, as home sales remained cool,” said RE/MAX CEO Adam Contos. “The good news is that inventory levels in January continued to rise on a year-over-year basis, providing incremental improvement in what’s been a multi-year shortage of for-sale homes. This is a positive for homebuyers, as the market continues to swing their way.”
 
The median sales price of $234,000 was a report record for January, increasing 4.6% over January 2018. But the rate of sales price increase was considerably less than the 6.7% posted from January 2017 to January 2018. December 2018 was the only month since January 2012 to show a year-over-year decline in median sales price.
 
Fifty-nine days on market was a record low for January sold listings – averaging one day less than the 60 posted in January 2018. January’s 3.9-month supply of inventory was higher than the 3.4-month supply of January 2018.
 
“Underlying demand remains solid overall, as evidenced by widespread price increases,” said Contos. “So the housing market, while not markedly busy in January, remains relatively healthy. Furthermore, with interest rates stabilizing and home-price increases slowing, the spring selling season shapes up to be as interesting as any we have seen in years.”
 
Closed Transactions 
Of the 54 metro areas surveyed in January 2019, the overall average number of home sales was down 26.1% compared to December 2018, and down 11.0% compared to January 2018. Only Billings, MT, experienced an increase in sales year-over-year, at +7.1%.
 
Median Sales Price – Median of 54 metro median prices
In January 2019, the median of all 54 metro Median Sales Prices was $234,000, down 2.5% from December 2018, and up 4.6% from January 2018. Four metro areas saw a year-over-year decrease in Median Sales Price, including Anchorage, AK, at -3.9%, Pittsburgh, PA, at -2.0%, Trenton, NJ, at -1.5%, and Birmingham, AL, at -0.5%. Six metro areas increased year-over-year by double-digit percentages, with the largest increases seen in Augusta, ME, at +12.1%, Las Vegas, NV, at +11.2%, and Wichita, KS at +10.5%.
 
Days on Market – Average of 54 metro areas
The average Days on Market for homes sold in January 2019 was 59, up four days from the average in December 2018, and down one day from the January 2018 average. The metro areas with the lowest Days on Market were Omaha, NE, at 32, Nashville, TN, at 41, and a three-way tie between Las Vegas, NV, Cincinnati, OH, and San Francisco, CA, at 43. The highest Days on Market averages were in Augusta, ME, at 100, Hartford, CT, at 94, and Anchorage, AK at 93. Days on Market is the number of days between when a home is first listed in an MLS and a sales contract is signed.
 
Months Supply of Inventory – Average of 54 metro areas
The number of homes for sale in January 2019 was down 2.6% from December 2018 and up 6.4% from January 2018. Based on the rate of home sales in January, the Months Supply of Inventory decreased to 3.9 from 4.1 in December 2018, and increased compared to 3.4 in January 2018. A six-months supply indicates a market balanced equally between buyers and sellers. In January 2019, nine of the 54 metro areas surveyed reported a supply at or over six months, typically indicating a buyer’s market, including Miami, FL, at 9.0 and Indianapolis, IN, at 8.6. Nine markets shared the lowest Months Supply of Inventory at 2.0.


Feel free to contact me and I can help break down exactly what these numbers mean for our local market and for your neighborhood. And lastly, If you or anyone you know is thinking of buying or selling a home - please call or email me. I'm here to help!

Peter Veres

Associate Broker,CRS,ABR,CLHMS,SRES

Elite Asset Management Team - RE/MAX Elite

www.PeteVeres.com

Cell: 505-362-2005

RE/MAX National Housing Report for September 2018

by Elite Asset Management Team

Home Sales Tumble 12% as Prices Remain at Record Levels


DENVER – The RE/MAX National Housing Report for September 2018 showed the trends of fewer closings and stabilizing inventory continued through September, punctuated by a surprisingly big 11.6% year-over-year drop in home sales. At the same time, the RE/MAX National Housing Report for September 2018 posted a Median Sales Price of $241,000 that marked the 30th consecutive month of year-over-year price increases. It is the highest September price in the 10-year history of the report.
 
The decline in home sales year-over-year was the largest since May of 2011, as September became the seventh month of 2018 to record lower sales than 2017. Even so, year-to-date 2018 home sales resemble 2017’s.
 
“The big drop in September closings catches your attention. The market is clearly rebalancing as buyers and sellers continue to process the increasing interest rate environment and what that means to them,” said RE/MAX CEO Adam Contos. “The slower drop in inventory – a visible trend for nearly half a year – further illustrates the ongoing shift toward market equilibrium, and that’s healthy in the long-term.”
 

Active inventory dropped for the 119th consecutive month, the decline of 4.7% from September 2017 was the smallest year-over-year decrease since August 2014. In addition, the September year-over-year inventory drop was the fifth consecutive month in 2018 to post single-digit percent declines rather than the double-digit monthly drops consistently seen over the previous three years.
 
“It’s a little surprising to see prices staying so strong, but it’s hardly shocking in such a tight market,” said Contos. “The headwinds of rising prices and interest rates amid already tight inventory levels have been crimping affordability and slowing sales for most of the year, but it varies by geography.  In circumstances like these, where the market is tricky to navigate, both buyers and sellers can benefit by aligning themselves with a professional agent – a local expert who can cut through the noise and advocate on their behalf.”
 
Other highlights include: 

  • Home prices rose by 5.6% over September 2017, more than twice the year-over-year price increase of 2.3% from September 2016 to September 2017. That reversed a trend seen in the previous three months, when year-over-year price increases trailed 2017’s rate of growth.
  • Months Supply of Inventory totaled 3.7, which is the second-lowest for September in report history, second only to 3.6 months in September 2017.
  • Days on Market of 46 was a September record for the report – three days less than September 2017.
     

Closed Transactions
Of the 54 metro areas surveyed in September 2018, the overall average number of home sales is down 24.4% compared to August 2018, and down 11.6% compared to September 2017. Six of the 54 metro areas experienced an increase in sales year-over-year, including Orlando, FL, +17.2%, Tampa, FL, +8.5, Miami, FL, +6.8% and Birmingham, AL at +4.0%.
 
Median Sales Price – Median of 54 metro median prices
In September 2018, the median of all 54 metro Median Sales Prices was $241,000, down 3.2% from August 2018 and up 5.6% from September 2017. Only three metro areas saw a year-over-year decrease in Median Sales Price; Birmingham, AL, -2.1%, Anchorage, AK, -2.0% and Honolulu, HI, -1.7%. Seven metro areas increased year-over-year by double-digit percentages, with the largest increases seen in Boise, ID, +17.9%, Manchester, NH, +13.4% and Salt Lake City, UT, +11.9%.  
 
Days on Market – Average of 54 metro areas
The average Days on Market for homes sold in September 2018 was 46, up three days from the average in August 2018, and down 3 days from the September 2017 average. The metro areas with the lowest Days on Market were Omaha, NE, at 19, San Francisco, CA, at 26, Seattle, WA, at 27, and five markets tied at 29 –Denver, CO, Cincinnati, OH, Indianapolis, IN, Las Vegas, NV, and Salt Lake City, UT. The highest Days on Market averages were in Augusta, ME, at 90, Burlington, VT, at 87, Hartford, CT at 81 and Miami, FL, at 79. Days on Market is the number of days between when a home is first listed in an MLS and a sales contract is signed.
 
Months Supply of Inventory – Average of 54 metro areas
The number of homes for sale in September 2018 was down 1.0% from August 2018 and down 4.7% from September 2017. Based on the rate of home sales in September, the Months Supply of Inventory increased to 3.7 from 3.0 in August 2018, and increased compared to September 2017 at 3.6. A 6.0-months supply indicates a market balanced equally between buyers and sellers. In September 2018, all but two of the metro areas surveyed – Miami, FL, at 8.0 and New York, NY, at 6.0 – reported a months supply less than 6.0, which is typically considered a seller’s market. The markets with the lowest Months Supply of Inventory are San Francisco, CA, at 1.9, Boise, ID, and Denver, CO, at 2.0 and Manchester, NH, and Omaha, NE, both at 2.3.


Feel free to contact me and I can help break down exactly what these numbers mean for our local market and for your neighborhood. And lastly, If you or anyone you know is thinking of buying or selling a home - please call or email me. I'm here to help!

Peter Veres
Associate Broker,CRS,ABR,CLHMS,SRES
Elite Asset Management Team - RE/MAX Elite
www.PeteVeres.com
Cell: 505-362-2005

Feel free to contact me and I can help break down exactly what these numbers mean for our local market and for your neighborhood. And lastly, If you or anyone you know is thinking of buying or selling a home - please call or email me. I'm here to help!


Peter Veres

Associate Broker,CRS,ABR,CLHMS,SRES

Elite Asset Management Team - RE/MAX Elite

www.PeteVeres.com

Cell: 505-362-2005

RE/MAX National Housing Report for August 2018

by Elite Asset Management Team


Home Sales Decline 1% as Inventory, Prices Level Out


DENVER – The RE/MAX National Housing Report for August 2018 shows increasing home prices, low inventory and a reduction in days on market. These combined factors made August 2018 the sixth time this year that home sales lagged behind last year’s pace—but only slightly at -1.1%.
 
Home prices rose by 3.7% over August 2017, much lower than the year-over-year price increase of 5.4% from August 2016 to August 2017. In fact, the past three months of 2018 have trailed 2017’s rate of price growth year-over-year—compare that to four of the first five months of 2018 when year-over-year price increases easily topped those posted in 2017.
 
The Median Sales Price of $248,500 marked the 29th consecutive month of year-over-year price increases.
 
Even though active inventory dropped for the 118th consecutive month, the decline of 5.4% from August 2017 marked the smallest year-over-year decrease since August 2014. In addition, the August 2018 inventory drop marked the fourth consecutive month in 2018 to post single-digit percent declines, rather than the double-digit monthly drops consistently seen in early 2018 and over the previous three years.
 
“It varies by market, but we’re hearing that buyers are being more selective and sellers are becoming more pragmatic,” said RE/MAX CEO Adam Contos. “That dynamic could bring inventory levels up, especially in the most overheated markets, where we expect to see the clearest signs of equilibrium returning. The economy is strong and potential buyers are out there—they just need more listings, at the right price points, to consider. We believe that balance will return, which will be good for everyone in the long run. It’s just a matter of when.” 
 
Contos added that although the lack of inventory continues to be a challenge, the trends suggest that the market finally appears to be rebalancing.
 
“The moderation we are experiencing seems to be a bit more than the normal seasonal lull we’d expect this time of year,” said Contos.
 
Closed Transactions 
Of the 54 metro areas surveyed in August 2018, the overall average number of home sales is down 0.4% compared to July 2018, and decreased 1.1% compared to August 2017. Twenty-two of the 54 metro areas experienced increases in sales year-over-year including, Houston, TX, +34.2%, Burlington, VT, +11.5%, New Orleans, LA, +10.7% and Tulsa, OK, 10.5%.
 
Median Sales Price – Median of 54 metro median prices
In August 2018, the median of all 54 metro Median Sales Prices was $248,500, down 0.7% from July 2018 and up 3.7% from August 2017. Only four metro areas saw year-over-year decreases in Median Sales Prices including Trenton, NJ, at -1.9%, Little Rock, AR, at -1.1%, Burlington, VT, at -0.3% and Birmingham, AL, at
-0.03%. Three metro areas increased year-over-year by double-digit percentages, with the largest increases seen in Boise, ID, +16.8%, San Francisco, CA, +11.7% and Augusta, ME, +10.2%.  
 
Days on Market – Average of 54 metro areas
The average Days on Market for homes sold in August 2018 was 43, up two days from the average in July 2018, and down 4 days from the August 2017 average. The metro areas with the lowest Days on Market were Omaha, NE, at 21, Seattle, WA, at 23, and San Francisco, CA, Denver, CO, and Cincinnati, OH, all tied with 25. The highest Days on Market averages were in Augusta, ME, at 91, Miami, FL, at 78, Hartford, CT at 77 and New York, NY, at 65. Days on Market is the number of days between when a home is first listed in an MLS and a sales contract is signed.
 
Months Supply of Inventory – Average of 54 metro areas
The number of homes for sale in August 2018 was down 1.0% from July 2018 and down 5.4% from August 2017. Based on the rate of home sales in August, the Months Supply of Inventory increased to 3.0 from 2.9 in July 2018, and decreased compared to August 2017 at 3.1. A 6.0-months supply indicates a market balanced equally between buyers and sellers. In August 2018, all but one, Miami, FL, of 54 metro areas surveyed reported a months supply at or less than 6.0, which is typically considered a seller’s market. The markets with the lowest Months Supply of Inventory are San Francisco, CA, at 1.4, Boise, ID, at 1.6, Denver, CO, at 1.7 and Salt Lake City, UT, at 1.8


Feel free to contact me and I can help break down exactly what these numbers mean for our local market and for your neighborhood. And lastly, If you or anyone you know is thinking of buying or selling a home - please call or email me. I'm here to help!


Peter Veres

Associate Broker,CRS,ABR,CLHMS,SRES

Elite Asset Management Team - RE/MAX Elite

www.PeteVeres.com

Cell: 505-362-2005


Office: 505-798-1000


Feel free to contact me and I can help break down exactly what these numbers mean for our local market and for your neighborhood. And lastly, If you or anyone you know is thinking of buying or selling a home - please call or email me. I'm here to help!


Peter Veres

Associate Broker,CRS,ABR,CLHMS,SRES

Elite Asset Management Team - RE/MAX Elite

www.PeteVeres.com

Cell: 505-362-2005

Office: 505-798-1000


June 2018 RE/MAX National Housing Report

by Elite Asset Management Team

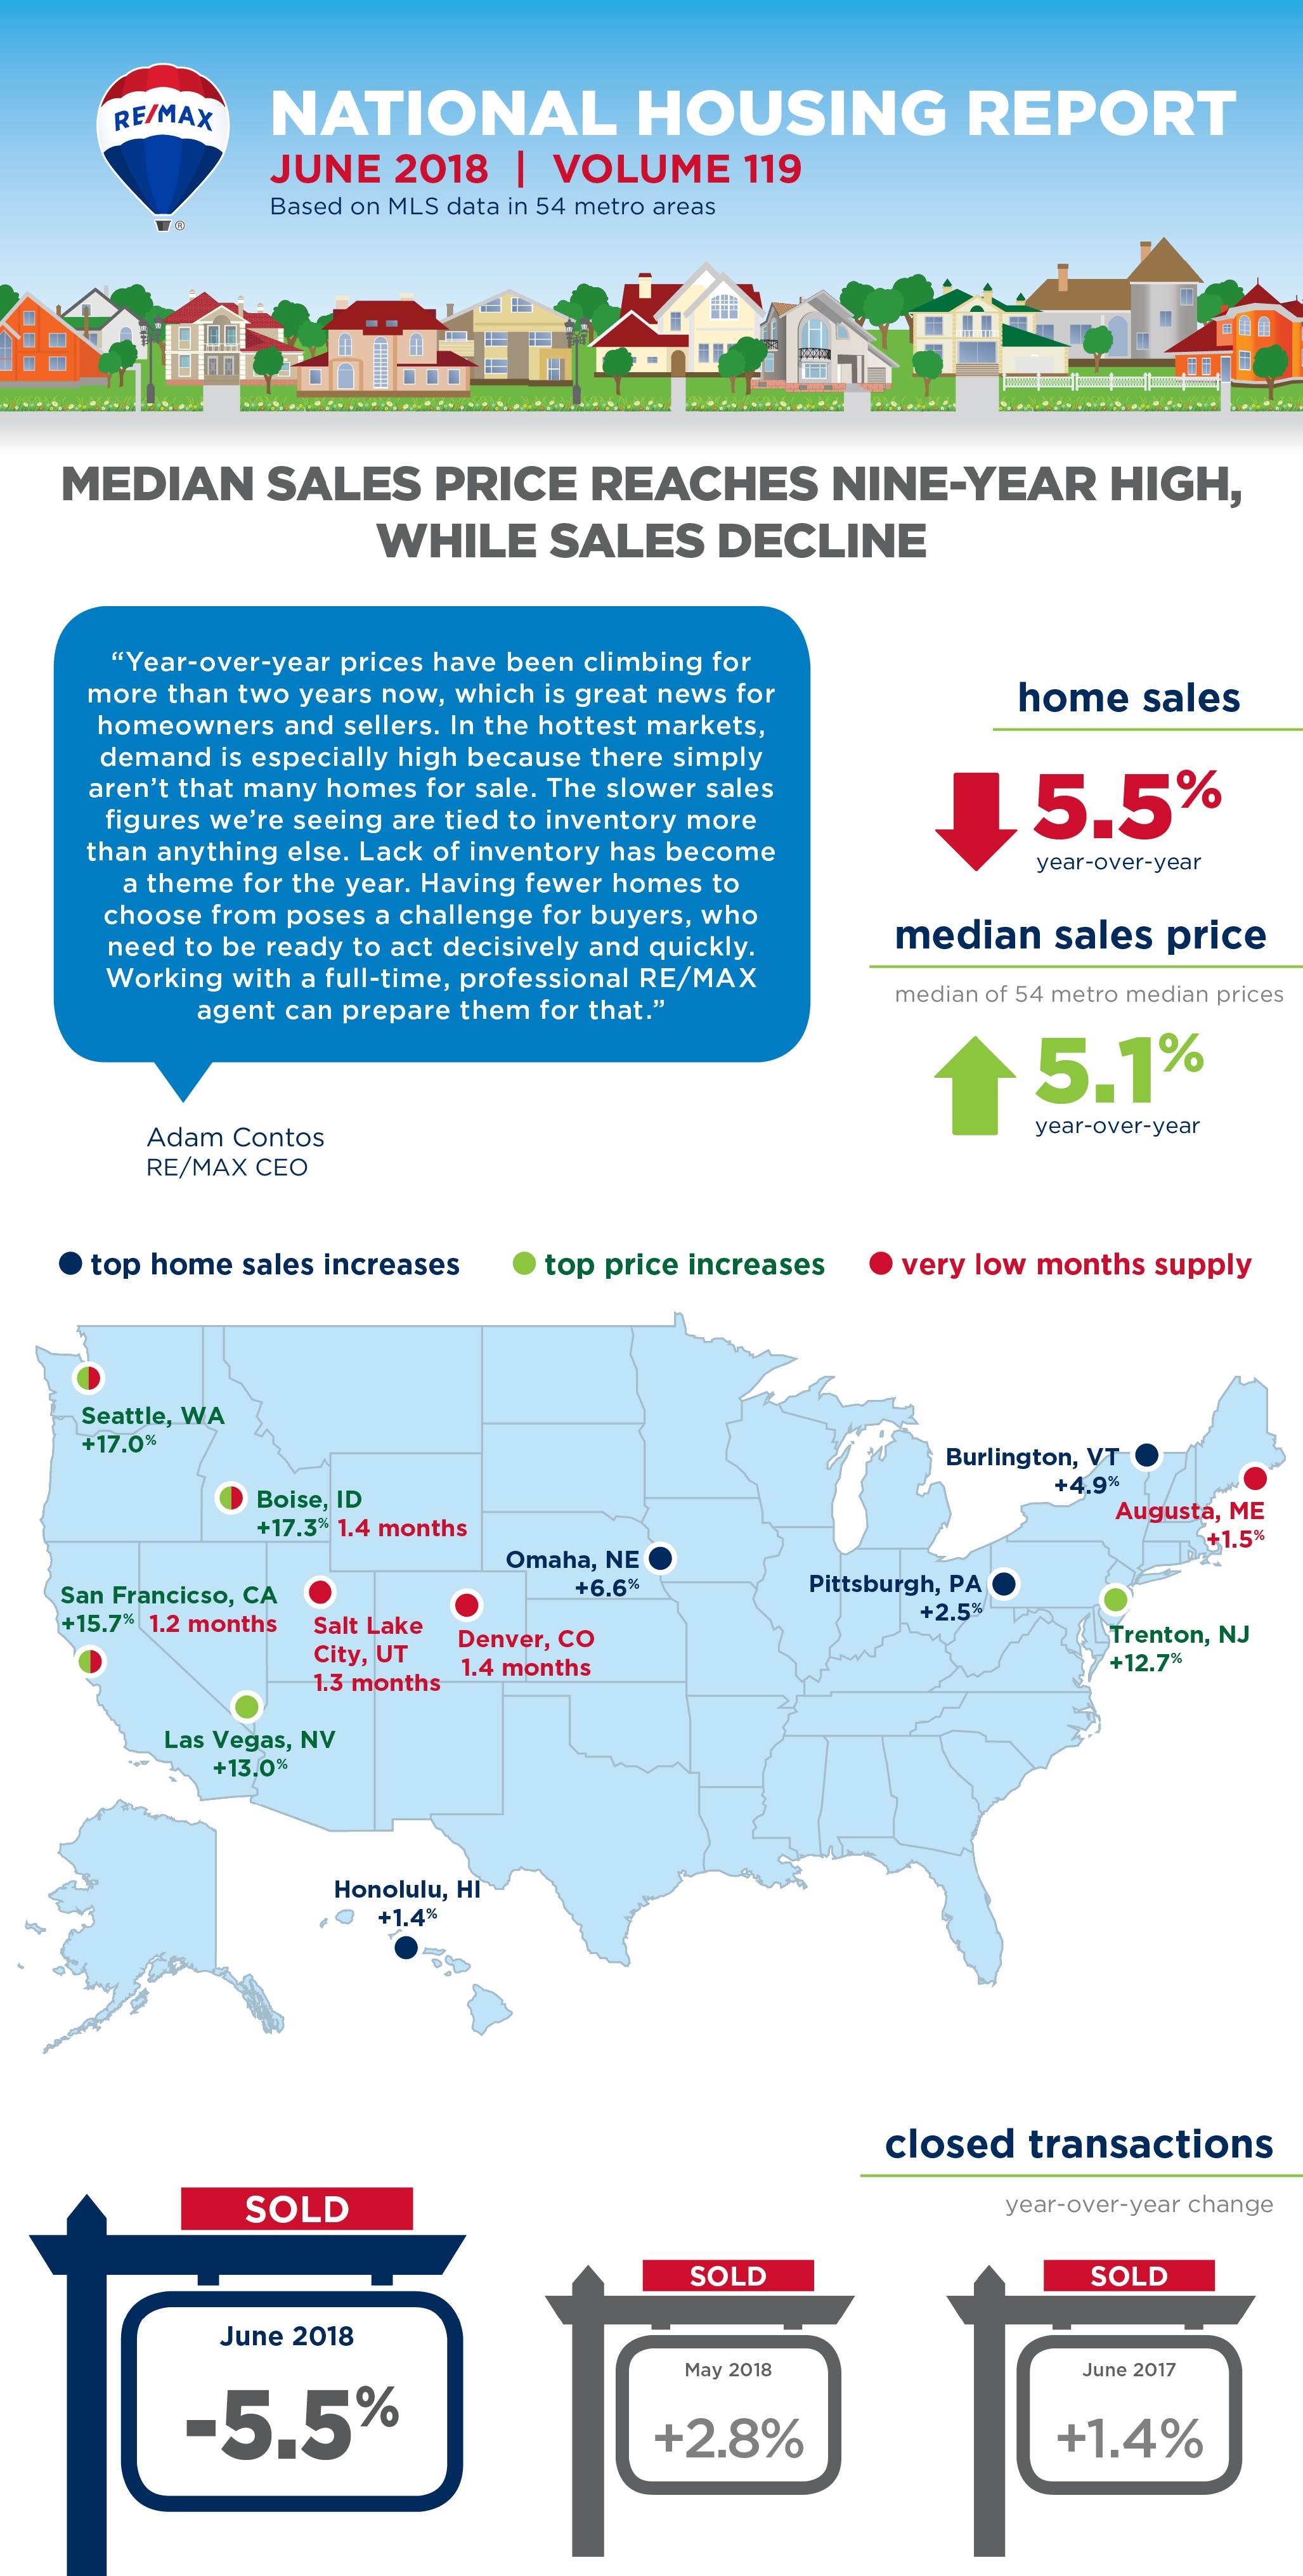
Median Sales Price Reaches Nine-Year High, While Sales Decline


July 18, 2018
DENVER – Halfway through 2018, prices are at record highs, inventory is at record lows and home sales are trailing 2017’s pace, according to the RE/MAX National Housing Report.
 
June sales were 5.5% lower than June 2017 in the 54 metro areas surveyed, marking the seventh consecutive month of year-over-year declines.
 
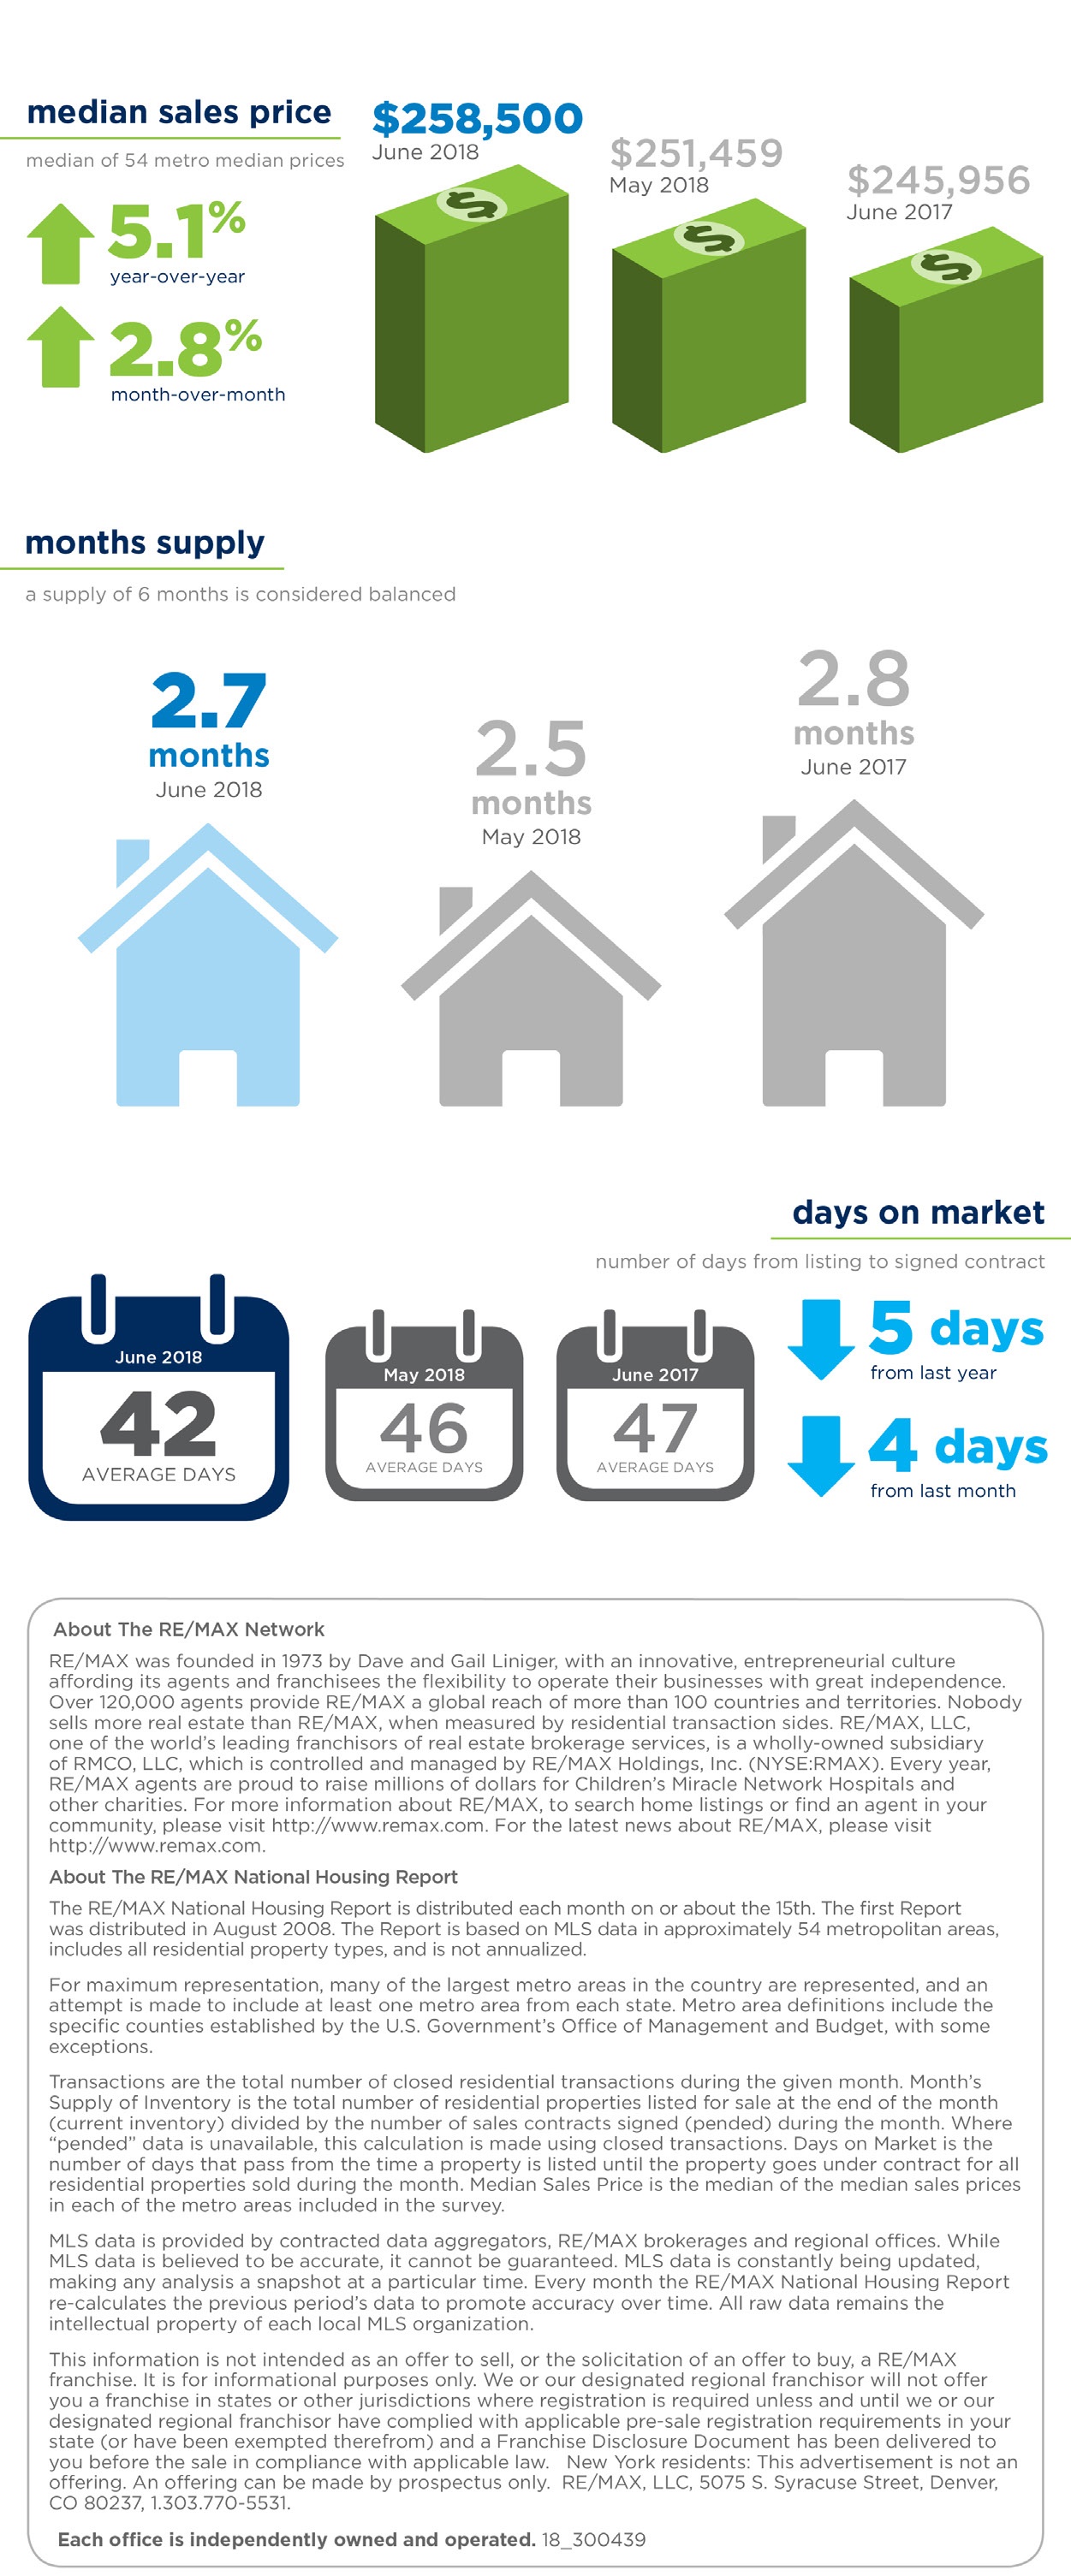
Headed in the opposite direction, the June Median Sales Price of $258,500 was an all-time high in the nine-year history of the report. It was 5.1% higher than the $245,000 recorded last June, bringing the consecutive months of year-over-year price increases to 27. In each of the previous five years – going back to June 2013’s $193,750 – June has posted the highest Median Sales Price of the year.
 
“Year-over-year prices have been climbing for more than two years now, which is great news for homeowners and sellers,” said RE/MAX CEO Adam Contos. “In the hottest markets, demand is especially high because there simply aren’t that many homes for sale. The slower sales figures we’re seeing are tied to inventory more than anything else.”
 
Forty-two of the 54 metro areas reported a year-over-year drop in inventory. That years-long trend is reflected in Months Supply of Inventory dropping to 2.7 – down 8.8% year-over-year and the smallest figure ever recorded for June. Fewer houses for sale generally results in a faster process: Homes sold in June averaged just 42 Days on Market – five days less than June 2017 and three days under the previous nine-year low of 45 days (July 2017).
 
“Lack of inventory has become a theme for the year,” Contos said. “Having fewer homes to choose from poses a challenge for buyers, who need to be ready to act decisively and quickly. Working with a full-time, professional RE/MAX agent can prepare them for that.”
 
Closed Transactions 
Of the 54 metro areas surveyed in June 2018, the overall average number of home sales increased 5.4% compared to May 2018 and decreased 5.5% compared to June 2017. Seven of the 54 metro areas experienced an increase in sales year-over-year including, Omaha, NE, +6.6%, Burlington, VT, +4.9%, Pittsburgh, PA, +2.5% and Augusta, ME, at +1.5%.   
 
Median Sales Price – Median of 54 metro median prices
In June 2018, the median of all 54 metro Median Sales Prices was $258,500, up 2.8% from May 2018 and up 5.1% from June 2017. Only two metro areas saw a year-over-year decrease in Median Sales Price including Billings, MT, -0.6% and Anchorage, AK at -0.4%. Five metro areas increased year-over-year by double-digit percentages, with the largest increases seen in Boise, ID, +17.3%, San Francisco, CA, +15.7%, Las Vegas, NV, +13%, and Trenton, NJ at +12.7%.
 
Days on Market – Average of 54 metro areas
The average Days on Market for homes sold in June 2018 was 42, down four days from the average in May 2018, and down 5 days from the June 2017 average. The metro areas with the lowest Days on Market were Seattle, WA at 17, San Francisco, CA at 20, Denver, CO, at 21 and Omaha, NE at 22. The highest Days on Market averages were in Augusta, ME, at 97, Miami, FL, at 76, Hartford, CT at 73 and New York, NY, at 72. Days on Market is the number of days between when a home is first listed in an MLS and a sales contract is signed.
 
Months Supply of Inventory – Average of 54 metro areas
The number of homes for sale in June 2018 was up 2.5% from May 2018, and down 8.8% from June 2017. Based on the rate of home sales in June, the Months Supply of Inventory increased to 2.7 from 2.5 in May 2018, and decreased compared to June 2017 at 2.8. A 6.0-months supply indicates a market balanced equally between buyers and sellers. In June 2018, all but one of 54 metro areas surveyed reported a months supply at or less than 6.0, which is typically considered a seller’s market. The markets with the lowest Months Supply of Inventory are in the west with San Francisco, CA, at 1.2, Salt Lake City, UT, 1.3, and Boise, ID and Denver, CO, both tied with 1.4.  

Feel free to contact me and I can help break down exactly what these numbers mean for our local market and for your neighborhood. And lastly, If you or anyone you know is thinking of buying or selling a home - please call or email me. I'm here to help!

Peter Veres

Associate Broker,CRS,ABR,CLHMS,SRES

Elite Asset Management Team - RE/MAX Elite

www.PeteVeres.com

Cell: 505-362-2005

Office: 505-798-1000


Displaying blog entries 31-40 of 70

Syndication

Categories

Archives

Contact Information

Photo of Elite Asset Management  Real Estate
Elite Asset Management
RE/MAX SELECT
8300 Carmel Ave. NE Ste. 203
Albuquerque NM 87122
(505)362-2005

zillow reviews