Real Estate Information Archive

Blog

Displaying blog entries 41-50 of 70

May 2018 RE/MAX National Housing Report

by Elite Asset Management Team

Prices Rise 7.8 Percent, But Homes Selling Faster and Faster 


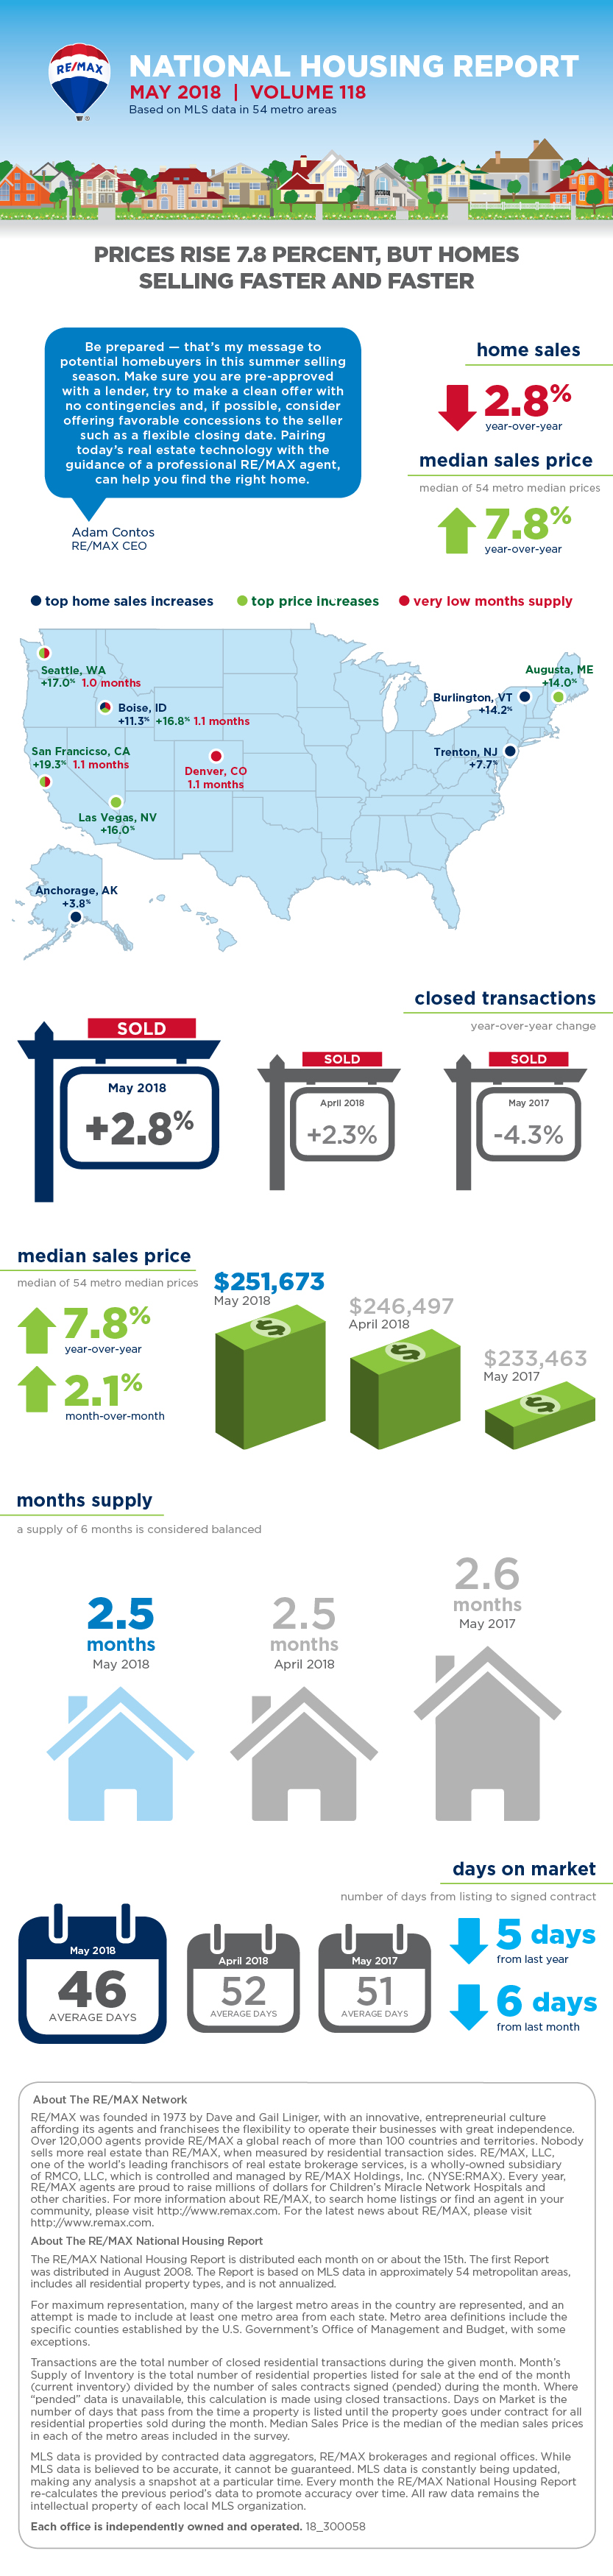
DENVER – In May, homes sold faster than at virtually any other time in the past decade, according to the latest RE/MAX National Housing Report. Low inventory and high demand in May cut Days on Market to 46, the second-lowest monthly number in the nearly 10-year history of the report.
 
May home sales topped April sales by 14.5%, and were down by 2.8% from May 2017. The median sales price of $251,673 was up 7.8%.
 
By comparison, homes averaged five more days on the market (51) in May 2017, 12 more days (58) in May 2016 and 18 more days (64) in 2015.
 
“Even with low inventory and the Federal Reserve raising interest rates, homes are going from ‘for sale’ to sold 28 percent faster than three years ago,” said RE/MAX CEO Adam Contos.
 
With 11 metro areas increasing the median sales price year-over-year by double digits, May is still a seller’s market, and homebuyers should expect to compete with other buyers when they are ready to make an offer on a home.
 
“Be prepared — that’s my message to potential homebuyers in this summer selling season,” added Contos. “Make sure you are pre-approved with a lender, try to make a clean offer with no contingencies and, if possible, consider offering favorable concessions to the seller such as a flexible closing date. Pairing today’s real estate technology with the guidance of a professional RE/MAX agent, can help you find the right home.”
 
Closed Transactions 
Of the 54 metro areas surveyed in May 2018, the overall average number of home sales increased 14.5% compared to April 2018 and decreased 2.8% compared to May 2017. Sixteen of the 54 metro areas experienced an increase in sales year-over-year, including, Burlington, VT, +14.2%, Boise, ID, +11.3%, Trenton, NJ, +7.7% and Anchorage, AK at +3.8%.
 
Median Sales Price – Median of 54 metro median prices
In May 2018, the median of all 54 metro Median Sales Prices was $251,673, up 2.1% from April 2018 and up 7.8% from May 2017. Three metro areas saw a year-over-year decrease in Median Sales Price: Trenton, NJ, -2.4%, Anchorage, AK, -1.2% and Hartford, CT, -0.7%. Eleven metro areas increased year-over-year by double-digit percentages, with the largest increases seen in San Francisco, CA, +19.3%, Boise, ID, +16.8%, Las Vegas, NV, +16% and Augusta, ME, +14%.
 
Days on Market – Average of 54 metro areas
The average Days on Market for homes sold in May 2018 was 46, down six days from the average in April 2018, and down five days from the May 2017 average. The metro areas with the lowest Days on Market were San Francisco, CA and Seattle, WA, at 19, Denver, CO, at 21 and Salt Lake City, UT, at 25. The highest Days on Market averages were in Augusta, ME, at 115, Hartford, CT, at 83, and New York, NY and Miami, FL at 82. Days on Market is the number of days between when a home is first listed in an MLS and a sales contract is signed.
 
Months Supply of Inventory – Average of 54 metro areas
The number of homes for sale in May 2018 was up 4% from April 2018, and down 9.5% from May 2017. Based on the rate of home sales in May, the Months Supply of Inventory remained unchanged from April 2018 at 2.5, and slightly decreased compared to 2.6 in May 2017. A 6.0-months supply indicates a market balanced equally between buyers and sellers. In May 2018, all 54 metro areas surveyed reported a months supply at or less than 6.0, which is typically considered a seller’s market. The markets with the lowest Months Supply of Inventory are in the west with San Francisco, CA, at 1.0 and Boise, ID, Denver, CO, and Seattle, WA, tied at 1.1.

Feel free to contact me and I can help break down exactly what these numbers mean for our local market and for your neighborhood. And lastly, If you or anyone you know is thinking of buying or selling a home - please call or email me. I'm here to help!

Peter Veres
Associate Broker, CRS,ABR,CLHMS,SRES

Elite Asset Management Team - RE/MAX Elite
www.PeteVeres.com
Cell: 505-362-2005
Office: 505-798-1000


Feel free to contact me and I can help break down exactly what these numbers mean for our local market and for your neighborhood. And lastly, If you or anyone you know is thinking of buying or selling a home - please call or email me. I'm here to help!

Peter Veres

Associate Broker,CRS,ABR,CLHMS,SRES

Elite Asset Management Team - RE/MAX Elite

www.PeteVeres.com

Cell: 505-362-2005

Office: 505-798-1000

April 2018 RE/MAX National Housing Report

by Elite Asset Management Team

Home Sales Increase 2.3% Despite Peaking Prices, Ever-Shrinking Inventory   


DENVER – Home sales increased 2.3% year-over-year in April 2018 in the face of record low inventory and the second-highest median sales price in the nine-year history of the RE/MAX National Housing Report. 
 
In April, San Francisco, CA reached a new benchmark surpassing $1 million for the metro area’s median sales price. Eight other metro areas including Las Vegas, NV, Seattle, WA and Boise, ID saw large double-digit price increases from just a year ago.
 
“If 2018 is like recent years, we’re only two months away from home prices peaking — we’re already seeing some impressive prices moving up in markets throughout the U.S.,” said RE/MAX CEO Adam Contos. “As we head into summer, we’ll watch several housing markers like home starts, mortgage applications and sales price to gauge the effect they’ll have on inventory across the country — the good news is that the rate of sales helps accommodate a shrinking inventory and buyers can still find opportunities.”
 
The $243,000 Median Sales Price was a record for April and was second only in report history to $245,000 in June 2017. In each of the last five years, June has produced the year’s highest Median Sales Price, with July or August posting the second-highest monthly price each year.
 
Notable metrics from this month’s RE/MAX National Housing Report:

  • Thirty-eight of the 53 markets in the report posted more sales than in April 2017, while the 2.5 months supply of inventory tied March as the lowest ever, in the history of the report
  • The average Days on Market in April was 52 — that’s five days less than April 2017 and a RE/MAX National Housing Report record for the month.

 
Closed Transactions 
Of the 53 metro areas surveyed in April 2018, the overall average number of home sales increased 3.6% compared to March 2018 and increased 2.3% compared to April 2017. Thirty-eight of the 53 metro areas experienced an increase in sales year-over-year including, Milwaukee, WI, 13.4%, Burlington, VT, 12.1%, Albuquerque, NM, 11.1%, and New Orleans, LA, at 9.1%.
 
Median Sales Price – Median of 53 metro median prices
In April 2018, the median of all 53 metro Median Sales Prices was $243,000, up 3.0% from March 2018 and up 7.5% from April 2017. Three metro areas saw a year-over-year decrease in Median Sales Price including, Trenton, NJ, -5.1%, Birmingham, AL, -3.0% and Wilmington/Dover, DE, -0.5%. Nine metro areas increased year-over-year by double-digit percentages, with the largest increases seen in Las Vegas, NV, 18%, Seattle, WA, 17%, Boise, ID, 15.8% and San Francisco, CA, 15.4%.
 
Days on Market – Average of 53 metro areas
The average Days on Market for homes sold in April 2018 was 52, down eight days from the average in March 2018, and down five days from the April 2017 average. The metro areas with the lowest Days on Market were San Francisco, CA, at 19, Seattle, WA, at 21, Denver, CO, at 23, and Las Vegas, NV, at 29. The highest Days on Market averages were in Augusta, ME, at 119, Burlington, VT, at 110 and Hartford, CT, at 91. Days on Market is the number of days between when a home is first listed in an MLS and a sales contract is signed.
 
Months Supply of Inventory – Average of 53 metro areas
The number of homes for sale in April 2018 was up 3.4% from March 2018, and down 11.3% from April 2017. Based on the rate of home sales in April, the Months Supply of Inventory remained at 2.5 from March 2018, and decreased compared to April 2017 at 2.8. A 6.0-months supply historically indicates a market that’s balanced equally between buyers and sellers. In April 2018, all 53 metro areas surveyed reported a months supply at or less than 6.0, which is typically considered a seller’s market. The markets with the lowest Months Supply of Inventory continue to be in the west with Boise, ID, Denver, CO, San Francisco, CA, and Seattle, WA, at 1.0.

Please note the name change to this month’s housing report. Beginning in May 2018, the title of the RE/MAX National Housing Report will reflect the month of MLS data being reported on in the report. For example, the April 2018 report reflects the April MLS data. 

Feel free to contact me and I can help break down exactly what these numbers mean for our local market and for your neighborhood. And lastly, If you or anyone you know is thinking of buying or selling a home - please call or email me. I'm here to help!

Peter Veres

Associate Broker, CRS,ABR,CLHMS,SRES

Elite Asset Management Team - RE/MAX Elite

www.PeteVeres.com

Cell: 505-362-2005

Office: 505-798-1000

April 2018 National Housing Report

by Elite Asset Management Team

Rising Prices, Fewer Sales Driven by Record-Breaking Low Inventory    


DENVER – If you are looking for a new home, chances are you’re not finding many homes on the market. If you’re a seller, you have likely noticed the value of your home is rising — no matter what part of the country you live in.
 
According to the April 2018 RE/MAX National Housing Report, home prices continued to climb year-over-year for the 24th consecutive month in March, while home sales continued to decline for a fourth consecutive month, making it a seller’s market in most regions of the country.
 
“Homebuyers shouldn’t be discouraged by the record-breaking numbers — even with higher prices and closed transactions, this March marks the second-highest in sales in the history of the RE/MAX National Housing Report,” said RE/MAX CEO Adam Contos. “It’s more important than ever to work with an experienced RE/MAX agent who is invested and involved in their community. They are dialed into the nuances of a neighborhood, making your home search or sale easier and quicker.”
 
When the Months Supply of Inventory falls below six months, it’s a seller’s market, and all 54 metro areas surveyed for the monthly housing reported under six months of inventory. 
 
“We also look at the Days on Market as another indicator of tight inventory and the national average stands at 60 days,” said Contos. “That’s four days less than a year ago and another March record-breaker.”
 
Closed Transactions 
Of the 54 metro areas surveyed in March 2018, the overall average number of home sales increased +36.6% compared to February 2018 and decreased -5.3% compared to March 2017. Nine of the 54 metro areas experienced an increase in sales year-over-year including, Milwaukee, WI, +22%, Boise, ID, 7.3%, Albuquerque, NM, +6.7%; and Anchorage, AK, +3.8%.
 
Median Sales Price – Median of 54 metro median prices
In March 2018, the median of all 54 metro Median Sales Prices was $236,000, up +3.2% from February 2018 and up +4.9% from March 2017. Four metro areas saw a year-over-year decrease in Median Sales Price including, Anchorage, AK, -3.4%, Billings, MT, -1.1%, Trenton, NJ, -0.5%; and Manchester, NH, -.02%. Twelve metro areas increased year-over-year by double-digit percentages, with the largest increases seen in Boise, ID, +19.9%, San Francisco, CA, +19.4%; and Seattle, WA, and Las Vegas, NV, tied at +15.6%.

Days on Market – Average of 54 metro areas
The average Days on Market for homes sold in March 2018 was 60, down two days from the average in February 2018, and down four days from the March 2017 average. The metro areas with the lowest Days on Market were San Francisco, CA, at 20, Seattle, WA, at 28, Denver, CO, at 30; and San Diego, CA, at 31. The highest Days on Market averages were in Augusta, ME, at 131, Burlington, VT, at 115, Chicago, IL, at 97; and Hartford, CT, at 96. Days on Market is the number of days between when a home is first listed in an MLS and a sales contract is signed.
 
Months Supply of Inventory – Average of 54 metro areas

The number of homes for sale in March 2018 was down -0.5% from February 2018, and down -14.7% from March 2017. Based on the rate of home sales in March, the Months Supply of Inventory decreased to 2.5 from February 2018 at 3.1, as well as decreased compared to March 2017 at 2.7. A 6.0-months supply indicates a market balanced equally between buyers and sellers. In March 2018, all 54 metro areas surveyed reported a months supply less than 6.0, which is typically considered a balanced market. The markets with the lowest Months Supply of Inventory continue to be in the west with San Francisco, CA, at 0.7, Denver, CO, and Seattle, WA, both at 0.9; and Boise, ID, and Omaha, NE, at 1.1.

Feel free to contact me and I can help break down exactly what these numbers mean for our local market and for your neighborhood. And lastly, If you or anyone you know is thinking of buying or selling a home - please call or email me. I'm here to help!

Peter Veres

Associate Broker, CRS,ABR,CLHMS,SRES

Elite Asset Management Team - RE/MAX Elite

www.PeteVeres.com

Cell: 505-362-2005

Office: 505-798-1000

March 2018 RE/MAX National Housing Report

by Elite Asset Management Team


Inventory Limits February Home Sales While Pushing Up Prices

DENVER – One word sums up February home sales across the country – inventory. The lack of homes for sale continues to be the key factor as February marks the third consecutive month of year-over-year declines in home sales, coupled with quick sales and record prices.

According to the March RE/MAX National Housing Report, home sales dropped 0.2% from February 2017, while the Days on Market average of 62 days was the lowest of any February in the report’s nine-year history.
 
“We shared our outlook of the real estate market in the new year and it seems that even two months into 2018 we’re already seeing records break,” said RE/MAX CEO Adam Contos. “The February 2018 median sales price of $228,700 marks the 22nd consecutive month of year-over-year price increases.”
 
The Months Supply of Inventory was 3.1 – also a RE/MAX National Housing Report February record – and underscored an average decline in inventory of 13.7% among the 52 markets reporting.

“While the hot markets like Denver and San Francisco continue to see low supplies of inventory, we’re also watching more homebuyers migrate into unexpected markets,” added Contos. “In one year, Billings, Montana, saw a 59 percent increase in home sales, along with Boise, Idaho, with a 25 percent increase in sales.”
 
Out of 52 markets, 18 metro areas saw double-digit percentage increases in median sales price year-over-year. While only two metros saw a year-over-year decrease in median sales price – Albuquerque, NM, and Burlington, VT.

Closed Transactions 
Of the 52 metro areas surveyed in February 2018, the overall average number of home sales increased +3.5% compared to January 2018 and decreased -0.2% compared to February 2017. Twenty-six of the 52 metro areas experienced an increase in sales year-over-year including, Billings, MT, +59.2%, Boise, ID, +25.4%, Burlington, VT, +20.4%, Milwaukee, WI, +19.6% and Richmond, VA, at +13.2%

Median Sales Price – Median of 52 metro median prices
In February 2018, the median of all 52 metro Median Sales Prices was $228,700, up +2.3% from January 2018 and up +8.1% from February 2017. Two metro areas saw a year-over-year decrease in Median Sales Price, Albuquerque, NM, -0.2% and Burlington, VT, -5.2%. Eighteen metro areas increased year-over-year by double-digit percentages, with the largest increases seen in Las Vegas, NV, +15.6%, San Francisco, CA, +15.5%, Seattle, WA, +15.4%, Pittsburgh, PA, +14.8% and Minneapolis, MN, +13.3%.

Days on Market – Average of 52 metro areas
The average Days on Market for homes sold in February 2018 was 62, up two days from the average in January 2018, and down six days from the February 2017 average. The metro areas with the lowest Days on Market were Las Vegas, NV, and San Diego, CA, at 36, Denver, CO, and Nashville, TN, both at 35, and Seattle, WA, at 33. The highest Days on Market averages were in Wilmington, DE, at 117, Wichita, KS, at 101, Washington, D.C., at 99 and Tulsa, OK, at 93. Days on Market is the number of days between when a home is first listed in an MLS and a sales contract is signed.
 
Months Supply of Inventory – Average of 52 metro areas
The number of homes for sale in February 2018 was down -1.0% from January 2018, and down -13.7% from February 2017. Based on the rate of home sales in February, the Months Supply of Inventory decreased to 3.1 from January 2018 at 3.4, as well as decreased compared to February 2017 at 3.6. A 6.0-months supply indicates a market balanced equally between buyers and sellers. In February 2018, 48 of the 52 metro areas surveyed reported a months supply at or less than 6.0, which is typically considered a seller’s market. The metro areas that saw a months supply above 6.0, which is typically considered a buyer’s market, were Miami, FL, at 7.0, New Orleans, LA, at 6.8, Augusta, ME, at 6.5 and Burlington, VT, at 6.4. The markets with the lowest Months Supply of Inventory continued to be in the west with Denver, CO, and Seattle, WA, at 1.0 and San Francisco, CA, at 1.1.

Feel free to contact me and I can help break down exactly what these numbers mean for our local market and for your neighborhood. And lastly, If you or anyone you know is thinking of buying or selling a home - please call or email me. I'm here to help!

Peter Veres

Associate Broker, CRS,ABR,CLHMS,SRES

Elite Asset Management Team - RE/MAX Elite

www.PeteVeres.com

Cell: 505-362-2005

Office: 505-798-1000


Feel free to contact me and I can help break down exactly what these numbers mean for our local market and for your neighborhood. And lastly, If you or anyone you know is thinking of buying or selling a home - please call or email me. I'm here to help! 
Peter Veres
Associate Broker, CRS,ABR,CLHMS,SRES
Elite Asset Management Team - RE/MAX Elite
www.PeteVeres.com
Cell: 505-362-2005
Office: 505-798-10

February 2018 RE/MAX National Housing Report

by Elite Asset Management Team


Speed of January Sales Felt More Like Spring Selling Season

DENVER – The record speed of January home sales may signal that buyers aren’t waiting around for the typical spring selling season to begin. Despite home sales being down 2.8% year-over-year, the February RE/MAX National Housing Report shows homes sold in a mere 60 days last month, marking the fewest Days on Market of any January in the nine-year history of the report. 
 
Days on Market typically decline each month leading into the heart of the spring and summer buying season in July and start increasing monthly as fall progresses into winter.

“We recently saw the groundhog predict six more weeks of winter, but January housing numbers are telling a different story,” said RE/MAX CEO Adam Contos. “It looks like the spring selling season may have arrived early because home buyers are not slowing down. The speed of this market is on pace with what we saw in the prime of the 2017 selling season.”
 
The Median Sales Price of $224,000 also set a January record — up 6.7% year-over-year. Out of 53 markets, 51 posted gains, marking January as the 22nd consecutive month of year-over-year price increases dating back to April 2016.
 
Closed Transactions 
Of the 53 metro areas surveyed in January 2018, the overall average number of home sales decreased 27.4% compared to December 2017 and decreased 2.8% compared to January 2017. Twenty of the 53 metro areas experienced an increase in sales year-over-year including, Milwaukee, WI, +13.6%, Albuquerque, NM, +12.8%, Kansas City, MO, +12.5%, and Boise, ID, +12%.

Median Sales Price – Median of 53 metro median prices
In January 2018, the median of all 53 metro Median Sales Prices was $224,000, down 4.7% from December 2017 but up 6.7% from January 2017. Billings, MT, was the only metro area to see a year-over-year decrease in Median Sales Price at -6.4%. Eleven metro areas increased year-over-year by double-digit percentages, with the largest increases seen in Boise, ID, +18.7%, Las Vegas, NV, +16.2%, San Francisco, CA, +14% and Orlando, FL, +13.8%. 

Days on Market – Average of 53 metro areas
The average Days on Market for homes sold in January 2018 was 60, up three days from the average in December 2017, and down six days from the January 2017 average. The metro areas with the lowest Days on Market were San Francisco, CA, at 31, Omaha, NE, at 34 and Nashville, TN at 36. The highest Days on Market averages were in Augusta, ME, at 109, Chicago, IL, at 96 and Hartford, CT, at 93. Days on Market is the number of days between when a home is first listed in an MLS and a sales contract is signed.
 
Months Supply of Inventory – Average of 53 metro areas
The number of homes for sale in January 2018 was down 4.8% from December 2017, and down 14.8% from January 2017. Based on the rate of home sales in December, the Months Supply of Inventory decreased to 3.4 from December 2017 at 3.7, as well as decreased compared to January 2017 at 3.8. A 6.0-months supply indicates a market balanced equally between buyers and sellers. In January 2018, 49 of the 53 metro areas surveyed reported a months supply at or less than 6.0, which is typically considered a seller’s market. The metro areas that saw a months supply above 6.0, which is typically considered a buyer’s market, were Birmingham, AL, at 8.2, Augusta, ME, at 7.5, Miami, FL, at 7.1 and New Orleans, LA, at 6.8. The markets with the lowest Months Supply of Inventory continued to be in the west with Denver, CO, San Francisco, CA and Seattle, WA at 1.1.
Feel free to contact me and I can help break down exactly what these numbers mean for our local market and for your neighborhood.
And lastly, If you or anyone you know is thinking of buying or selling a home - please call or email me. I'm here to help!
 
Peter Veres
Associate Broker, CRS,ABR,CLHMS,SRES
Elite Asset Management Team - RE/MAX Elite
www.PeteVeres.com
Cell: 505-362-2005
Office: 505-798-1000
Feel free to contact me and I can help break down exactly what these numbers mean for our local market and for your neighborhood. And lastly, If you or anyone you know is thinking of buying or selling a home - please call or email me. I'm here to help! 

Peter Veres
Associate Broker, CRS,ABR,CLHMS,SRES
Elite Asset Management Team - RE/MAX Elite
www.PeteVeres.com
Cell: 505-362-2005
Office: 505-798-1000

January 2018 RE/MAX National Housing Report

by Elite Asset Management Team

2017 Closes Strong, Record High December Home Prices


DENVER – While sales dropped slightly from a year ago, December capped off a 2017 of record home prices, speedy sales and low inventory.
 
The January RE/MAX National Housing Report shows the median home price rose 8.1% year-over-year, with 50 of the report’s 54 markets posting increases. At the same time, December sales dropped 3.3% from December 2016, with 39 markets reporting fewer transactions. Making sales harder was a Months Supply of Inventory of 3.7 which is the lowest December figure in the nine-year history of the report. That corresponds with a 14.6% decline in inventory, lengthening a streak of monthly declines that began in November 2008.
 
Also setting a report record for December was the speed of home sales: 57 days. That figured into an overall 2017 median for Days on Market of 52.5 — nearly a week less than the 2016 median of 58.5 days.
 
Home buyers paid record prices in 2017, led by June’s Median Price Sold of $245,000. Prices increased year-over-year in every month of 2017, with December marking the 21st consecutive month of year-over-year price increases dating back to April 2016.
 
“We see the median sales price of homes across the country rising every month, year-over-year, but the days on market and the supply of homes for sale hit record lows in December,” said Adam Contos, RE/MAX Co-CEO. “If inventory keeps getting tighter across the country it’ll be interesting to see how it might affect sales.”
 
Closed Transactions 
Of the 54 metro areas surveyed in December 2017, the overall average number of home sales decreased 2.5% compared to November 2017 and decreased 3.3% compared to December 2016. Fifteen of the 54 metro areas experienced an increase in sales year-over-year including, Trenton, NJ, +13.9%, Richmond, VA, +10.9%, Burlington, VT, +8.1%, and Raleigh-Durham, NC, +5.4%.

Median Sales Price – Median of 54 metro median prices
In December 2017, the median of all 54 metro Median Sales Prices was $232,500, up 3.1% from November 2017 and up 8.1% from December 2016. Only four metro areas saw a year-over-year decrease in Median Sales Price; Anchorage, AK, -6.5%, Wichita, KS, -3.9%, Fargo, ND, -1.8% and Wilmington/Dover, DE, -.90%. Ten metro areas increased year-over-year by double-digit percentages, with the largest increases seen in San Francisco, CA, +17.8%, Las Vegas, NV, +17.1%, Seattle, WA, +13% and Boise, ID, +12.8%. 

Days on Market – Average of 54 metro areas
The average Days on Market for homes sold in December 2017 was 57, up three days from the average in November 2017, and down five days from the December 2016 average. The four metro areas with the lowest Days on Market were Omaha, NE and San Francisco, CA, at 27, Nashville, TN, at 31 and Seattle, WA, at 34. The highest Days on Market averages were in Augusta, ME, at 122 and Chicago, IL, and Miami, FL, at 86. Days on Market is the number of days between when a home is first listed in an MLS and a sales contract is signed.
 
Months Supply of Inventory – Average of 54 metro areas
The number of homes for sale in December 2017 was down 14% from November 2017, and down 14.6% from December 2016. Based on the rate of home sales in December, the Months Supply of Inventory increased to 3.7 from November 2017 at 3.6, but decreased compared to December 2016 at 4.2. A 6.0-months supply indicates a market balanced equally between buyers and sellers. In December 2017, 52 of the 54 metro areas surveyed reported a months supply at or less than 6.0, which is typically considered a seller’s market. The metro areas that saw a months supply above 6.0, which is typically considered a buyer’s market, were Augusta, ME, at 9.5 and Miami, FL, at 8.7. The markets with the lowest Months Supply of Inventory continued to be in the west with San Francisco, CA, at 0.9, Seattle, WA, at 1.4, and Denver, CO, 1.5.

Feel free to contact me and I can help break down exactly what these numbers mean for our local market and for your neighborhood.
And lastly, If you or anyone you know is thinking of buying or selling a home - please call or email me. I'm here to help!
 
Peter Veres
Associate Broker, CRS,ABR,CLHMS,SRES
Elite Asset Management Team - RE/MAX Elite
www.PeteVeres.com
Cell: 505-362-2005
Office: 505-798-1000

December 2017 RE/MAX National Housing Report

by Elite Asset Management Team

Sales Up Despite Years of Rising Prices, Falling Inventory


DENVER - November became the sixth month of 2017 to post an increase in year-over-year home sales, bucking prolonged trends of home price increases and inventory declines, according to the December RE/MAX National Housing Report.

The sales increase of 1.1% came on the strength of increased transaction closings in 36 of the report’s 54 markets. At the same time, buyers felt increasing headwinds as the Median Sales Price rose to $227,500 and marked the 20th consecutive month of year-over-year home price increases. In fact, the Median Sales Price has increased year-over-year in 69 of the last 70 months dating back to February 2012.

November's inventory decline of 14.5% extended the streak of consecutive months of fewer homes on the market to 108. The current streak started nine years ago, in November 2008, shortly after the RE/MAX National Housing Report was introduced.

Setting new report lows for November were Days on Market at 54 and Months Supply of Inventory at 3.6

“The end of the year is typically a slower selling season with low inventory, but our numbers are telling a different story,” said Adam Contos, RE/MAX Co-CEO. “We don’t see any sign of home buyers slowing down their house hunting. In fact, many are taking advantage of lower competition for available homes in the ‘slow season.’”

Contos added that, while consumer confidence is up and unemployment remains low, new home starts continue to lag because of material costs and a labor shortage. “Until we begin to see new homes being built, we won’t see much growth in available homes on the market,” he said.

Closed Transactions

Of the 54 metro areas surveyed in November 2017, the overall average number of home sales decreased 7.3% compared to October 2017 but increased 1.1% compared to November 2016. Thirty-six of the 54 metro areas experienced an increase in sales year-over-year, including Trenton, NJ, +21.3%, Augusta, ME, +14.5%, Honolulu, HI, +14.1%, and Manchester, NH, +14.0%.

Median Sales Price – Median of 54 metro median prices

In November 2017, the median of all 54 metro Median Sales Prices was $227,500, up 1.7% from October 2017 and up 3.7% from November 2016. Only five metro areas saw a year-over-year decrease in Median Sales Price, including Anchorage, AK, -5.3%, Trenton, NJ, -4.2%, and Honolulu, HI, -3.4%. Nine metro areas increased year-over-year by double-digit percentages, with the largest increases seen in San Francisco, CA, +13.8%, Cleveland, OH, +12.9%, Orlando, FL, +11.6%, and Seattle, WA, +11.4%. 

Days on Market – Average of 54 metro areas

The average Days on Market for homes sold in November 2017 was 54, up three days from the average in October 2017, and down five days from the November 2016 average. The four metro areas with the lowest Days on Market were San Francisco, CA, at 25, Omaha, NE, at 27, Seattle, WA, at 29, and Nashville, TN, at 30. The highest Days on Market averages were in Augusta, ME, at 116, and Miami, FL, at 86. Days on Market is the number of days between when a home is first listed in an MLS and a sales contract is signed.

Months Supply of Inventory – Average of 54 metro areas

The number of homes for sale in November 2017 was down 9.2% from October 2017, and down 14.5% from November 2016. Based on the rate of home sales in November, the Months Supply of Inventory increased to 3.6 from 3.3 in October 2017, but decreased compared to the 4.0 of November 2016. A 6 months supply indicates a market balanced equally between buyers and sellers. In November 2017, 49 of the 54 metro areas surveyed reported a months supply at or less than 6, which is typically considered a seller’s market. The metro areas that saw a months supply above 6.0, typically considered a buyer’s market, were Augusta, ME, at 8.4, Miami, FL, at 7.6, and Fargo, ND, at 6.5. The markets with the lowest Months Supply of Inventory continued to be in the West, with San Francisco, CA, at 1.0, Seattle, WA, at 1.3, and Denver, CO, at 1.4.

Feel free to contact me and I can help break down exactly what these numbers mean for our local market and for your neighborhood.

And lastly, If you or anyone you know is thinking of buying or selling a home - please call or email me. I'm here to help!


Peter Veres

Associate Broker, CRS,ABR,CLHMS,SRES

Elite Asset Management Team - RE/MAX Elite

www.PeteVeres.com

Cell: 505-362-2005

Office: 505-798-1000


November 2017 RE/MAX National Housing Report

by Elite Asset Management Team

Nationwide Seller’s Market Reigns as Home Prices Climb


DENVER – Despite record low inventory for the month, October home sales increased 2.5% year-over-year and kept 2017 prices ahead of 2016, according to this month’s RE/MAX National Housing Report. To access the housing report infographic, visit: rem.ax/2cYFT50.

Thirty-seven of the 53 metro markets in the November RE/MAX National Housing Report posted sales increases over October 2016. Meanwhile, inventory gauges were at their lowest point for an October in the report’s nine year history. The Months Supply of Inventory dropped to 3.3 – the lowest for any October in this housing report. It was mirrored by the Days on Market average of 51 days, also a new low for October for the report and a full week faster than the selling rate of homes in October of last year.
 
The Median Sales Price of $224,000 increased 3.3% over last October and was $19,000 higher than the same month in 2015. The median price remained on a par with the prices of last spring that kicked off the peak summer selling season.
 
“The housing market is steady and at least somewhat predictable with record-low inventory and increasing prices in markets across the country,” said Adam Contos, RE/MAX Co-CEO. “With job growth and increased household formation, buyers will struggle and may even be priced out of the market until home building catches up.”
 
Closed Transactions 
Of the 53 metro areas surveyed in October 2017, the overall average number of home sales decreased 3.4% compared to September 2017 but increased 2.5% compared to October 2016. Thirty-seven of the 53 metro areas experienced an increase in sales year-over-year including, Albuquerque, NM,+19.8%, Augusta, ME, +14.1%, Las Vegas, NV, +13.2%, Billings, MT, +12.4% and Providence, RI +11.4%.

Median Sales Price – Median of 53 metro median prices
In October 2017, the median of all 53 metro Median Sales Prices was $224,000, down 1.1% from September 2017 but up 3.3% from October 2016. Only three metro areas saw a year-over-year decrease in Median Sales Price or remained unchanged (Wilmington/Dover, DE, -4.1%, Trenton, NJ, -1.0%, and Cincinnati, OH, at 0.0%). Eight metro areas increased year-over-year by double-digit percentages, with the largest increases seen in Las Vegas, NV, +16.3%, Birmingham, AL, +12.3%, New Orleans, LA, +12.3%, Des Moines, IA, +12.0% and Seattle, WA, +11.6%.

Days on Market – Average of 53 metro areas
The average Days on Market for homes sold in October 2017 was 51, up two days from the average in September 2017, and down seven days from the October 2016 average. The four metro areas with the lowest Days on Market were San Francisco, CA, at 24, Omaha, NE, at 26, Seattle, WA, at 27, and Nashville, TN, at 28. The highest Days on Market averages were in Augusta, ME, at 108 and Burlington, VT, at 89. Days on Market is the number of days between when a home is first listed in an MLS and a sales contract is signed. 
 
Months Supply of Inventory – Average of 53 metro areas
The number of homes for sale in October 2017 was down 6.3% from September 2017, and down 13.4% from October 2016. Based on the rate of home sales in October, the Months Supply of Inventory decreased to 3.3 from September 2017 at 3.6, compared to October 2016 at 3.9. A 6.0-months supply indicates a market balanced equally between buyers and sellers. In October 2017, 50 of the 53 metro areas surveyed reported a months supply at or less than 6.0, which is typically considered a seller’s market. The metro areas that saw a months supply above 6.0, which is typically considered a buyer’s market, were Miami, FL, at 7.3, Birmingham, AL, at 6.8 and Augusta, ME, at 6.5. The markets with the lowest Months Supply of Inventory continued to be in the west with San Francisco, CA, at 1.0, Denver, CO and Seattle, WA, at 1.3, and San Diego, CA, at 1.8.


Feel free to contact me and I can help break down exactly what these numbers mean for our local market and for your neighborhood.
And lastly, If you or anyone you know is thinking of buying or selling a home - please call or email me. I'm here to help!
Peter Veres
Associate Broker, CRS,ABR,CLHMS,SRES
Elite Asset Management Team - RE/MAX Elite
www.PeteVeres.com
Cell: 505-362-2005
Office: 505-798-1000

Feel free to contact me and I can help break down exactly what these numbers mean for our local market and for your neighborhood.
And lastly, If you or anyone you know is thinking of buying or selling a home - please call or email me. I'm here to help!


Peter Veres
Associate Broker, CRS,ABR,CLHMS,SRES
Elite Asset Management Team - RE/MAX Elite


www.PeteVeres.com
Cell: 505-362-2005
Office: 505-798-1000

October 2017 RE/MAX National Housing Report

by Elite Asset Management Team

September Home Sales Slow Amid Strong Prices, Low Inventory


DENVER – September became the fifth month this year to post a decline in home sales compared to a record-setting 2016, while marking the 71st consecutive month of rising sale prices year-over-year, according to the October RE/MAX National Housing Report.

Joining August, July, April and February, September home sales dropped 4.2% year-over-year in the report’s monthly analysis of housing data in 54 metro areas. Going in the opposite direction, the Median Sales Price increased to $225,000. Though the lowest price since March, it was 2.3% higher than September 2016. The last month when home prices did not increase year-over-year was October 2011.

Three-quarters of the way through 2017, other notable numbers from the RE/MAX National Housing Report include:

In the wake of Hurricane Irma in early September, Miami saw home sales drop 35.2% year-over-year. Houston, meanwhile, posted a 3.2% gain despite the impact of Hurricane Harvey in late August.

Days on Market declined by one week, from 56 in September 2016 to 49.

At 3.6, the Months Supply of Inventory was the lowest of any September in the report’s 9-year history. Twenty-three markets are at 3 months or less.

Mirroring this, inventory dropped 14.1% year-over-year, with 46 metro areas seeing fewer homes for sale. Year-over-year, inventory has declined every month since November 2008.

“We’re not seeing any relief from the nationwide housing shortage as we enter the typically slower fall and winter selling seasons,” said Adam Contos, RE/MAX Co-CEO. “Plain and simple, we need more homes, particularly at the entry-level price point. Until then, it will most likely continue to be a seller’s market with homes going from listed to sold quickly.”


Closed Transactions

Of the 54 metro areas surveyed in September 2017, the overall average number of home sales decreased 14.9% compared to August 2017 and decreased 4.2% compared to September 2016. Sixteen of the 54 metro areas experienced an increase in sales year-over-year including, Billings, MT,+18.4%, Burlington, VT, +7.6%, Chicago, IL, 7.4%, Honolulu, HI, +4.6% and Las Vegas, NV +3.8%.


Median Sales Price – Median of 54 metro median prices

In September 2017, the median of all 54 metro Median Sales Prices was $225,000, down 5% from August 2017 but up 2.3% from September 2016. Only five metro areas saw a year-over-year decrease in Median Sales Price or remained unchanged (Trenton, NJ, -8.5%, Hartford, CT, -5.3%, Billings, MT, -2.2%, and Augusta, ME and Baltimore, MD at 0.0%). Eight metro areas increased year-over-year by double-digit percentages, with the largest increases seen in Seattle, WA, +13.7%, San Francisco, CA, +13.2%, Providence, RI, +13%, Las Vegas, NV, +12.2% and Tampa, FL, +11.4%.


Days on Market – Average of 54 metro areas

The average Days on Market for homes sold in September 2017 was 49, up two days from the average in August 2017, and down seven days from the September 2016 average. The four metro areas with the lowest Days on Market were Omaha, NE, at 23, Seattle, WA, at 25, and San Francisco, CA, at 26. The highest Days on Market averages were in Augusta, ME, at 105 and Burlington, VT, at 94. Days on Market is the number of days between when a home is first listed in an MLS and a sales contract is signed.


Months Supply of Inventory – Average of 54 metro areas

The number of homes for sale in September 2017 was down 3.6% from August 2017, and down 14.1% from September 2016. Based on the rate of home sales in September, the Months Supply of Inventory increased to 3.6 from August 2017 at 3.1, compared to September 2016 at 3.9. A 6.0-months supply indicates a market balanced equally between buyers and sellers. In September 2017, 51 of the 54 metro areas surveyed reported a months supply of less than 6.0, which is typically considered a seller’s market. The metro areas that saw a months supply above 6.0, which is typically considered a buyer’s market, were Miami, FL, at 11.8, Augusta, ME, at 6.4, and Birmingham, AL, at 6.3. The markets with the lowest Months Supply of Inventory continued to be in the west with San Francisco, CA, at 1.2, Seattle, WA, at 1.5, Denver, CO, at 1.6 and San Diego, CA, at 1.8.


Displaying blog entries 41-50 of 70

Syndication

Categories

Archives

Contact Information

Photo of Elite Asset Management  Real Estate
Elite Asset Management
RE/MAX SELECT
8300 Carmel Ave. NE Ste. 203
Albuquerque NM 87122
(505)362-2005

zillow reviews