Real Estate Information Archive

Blog

Displaying blog entries 1-4 of 4

MARCH 2017 RE/MAX NATIONAL MARKET UPDATE

by Elite Asset Management Team

Home Prices at New High in February Amid Record Low Inventory


DENVER – February home prices reached a new high as steady demand combined with record low inventory drove prices up, according to this month’s RE/MAX National Housing Report that surveys 53 metro areas.
 
Last month saw a negligible decline (-0.02%) in home sales from February 2016, which posted the most sales in the nine-year history of the report. Less than half of the markets experienced an increase in sales year-over-year.
 
Meanwhile, active inventory reached a record low for February, dropping 17.9% year-over-year. This marks the 100th consecutive month of year-over-year declines dating back to October 2008.
 
As a result, the Median Sales Price of $212,000 – another February record – was up 6% year-over-year. This is the 11th consecutive month of year-over-year price increases.
 
Homes sold faster last month, with average Days on Market dropping from 75 in February 2016 to 68 last month. 
 
“Inventory, not the rise in interest rates, remains the principal constraint on home sales,” said Dave Liniger, RE/MAX CEO, Chairman of the Board and Co-Founder“The resale market is driven dramatically by the availability of new homes. Most U.S. markets have a high demand for new home construction, and although it’s good to see housing starts trending upward, we still need more.”
 
Closed Transactions 
Of the 53 metro areas surveyed in February 2017, the overall average number of home sales decreased 0.02% compared to February 2016. Of the 53 metro areas, 23 experienced an increase in sales year-over-year, with nine experiencing double-digit increases.  The markets with the largest increase in sales included Trenton, NJ +26.2%, Nashville, TN +19.4%, Las Vegas, NV +18.2%, Wichita, KS +14.6% and Birmingham, AL +13.3%.
 
Median Sales Price – Median of 53 metro median prices
In February 2017, the median of all 53 metro Median Sales Prices was $212,000, up 1.4% from January 2017 and up 6.0% from February 2016. Only six metro areas saw year-over-year decreases or remained unchanged, with 16 rising by double-digit percentages. The largest double-digit increases were seen in Fargo, ND +19.9%, Burlington, VT +18.4%, Tampa, FL +15.9%, Indianapolis +14.3% and Dallas/Ft. Worth, TX +13.9%.

Days on Market – Average of 53 metro areas
The average Days on Market for homes sold in February 2017 was 68, up two days from the average in January 2017, but down seven days from the February 2016 average. The three metro areas with the lowest Days on Market were San Francisco, CA at 32, Omaha, NE at 34 and Denver, CO at 38. The highest Days on Market averages were in Augusta, ME at 147 and Chicago, IL at 109. Days on Market is the number of days between when a home is first listed in an MLS and a sales contract is signed. 
 
Months Supply of Inventory – Average of 53 metro areas
The number of homes for sale in February 2017 was down 2.2% from January 2017, and down 17.9% from February 2016. Based on the rate of home sales in February, the Months Supply of Inventory was 3.6, compared to January 2017 at 3.8 and February 2016 at 4.0. A 6.0-month supply indicates a market balanced equally between buyers and sellers. In February 2017, 45 of the 53 metro areas surveyed reported a months supply of less than 6.0, which is typically considered a seller’s market. The remaining eight saw a months supply above 6.0, which is typically considered a buyer’s market. The markets with the lowest Months Supply of Inventory continued to be in the west, with both Denver, CO and Seattle, WA at 1.0 and San Francisco, CA at 1.1.

Seniors - SRES Market Place March Newsletter

by Elite Asset Management Team

Pete Veres wants to share this month’s Seniors SRES- newsletter. Topics include: Housing Challenges Ahead for Exploding Senior Population & What not to say to care givers. Click here: SRES March Newsletter Please contact your local Seniors Real Estate Specialist if you or any family or friends need any help with your real estate need. Here to help and serve.


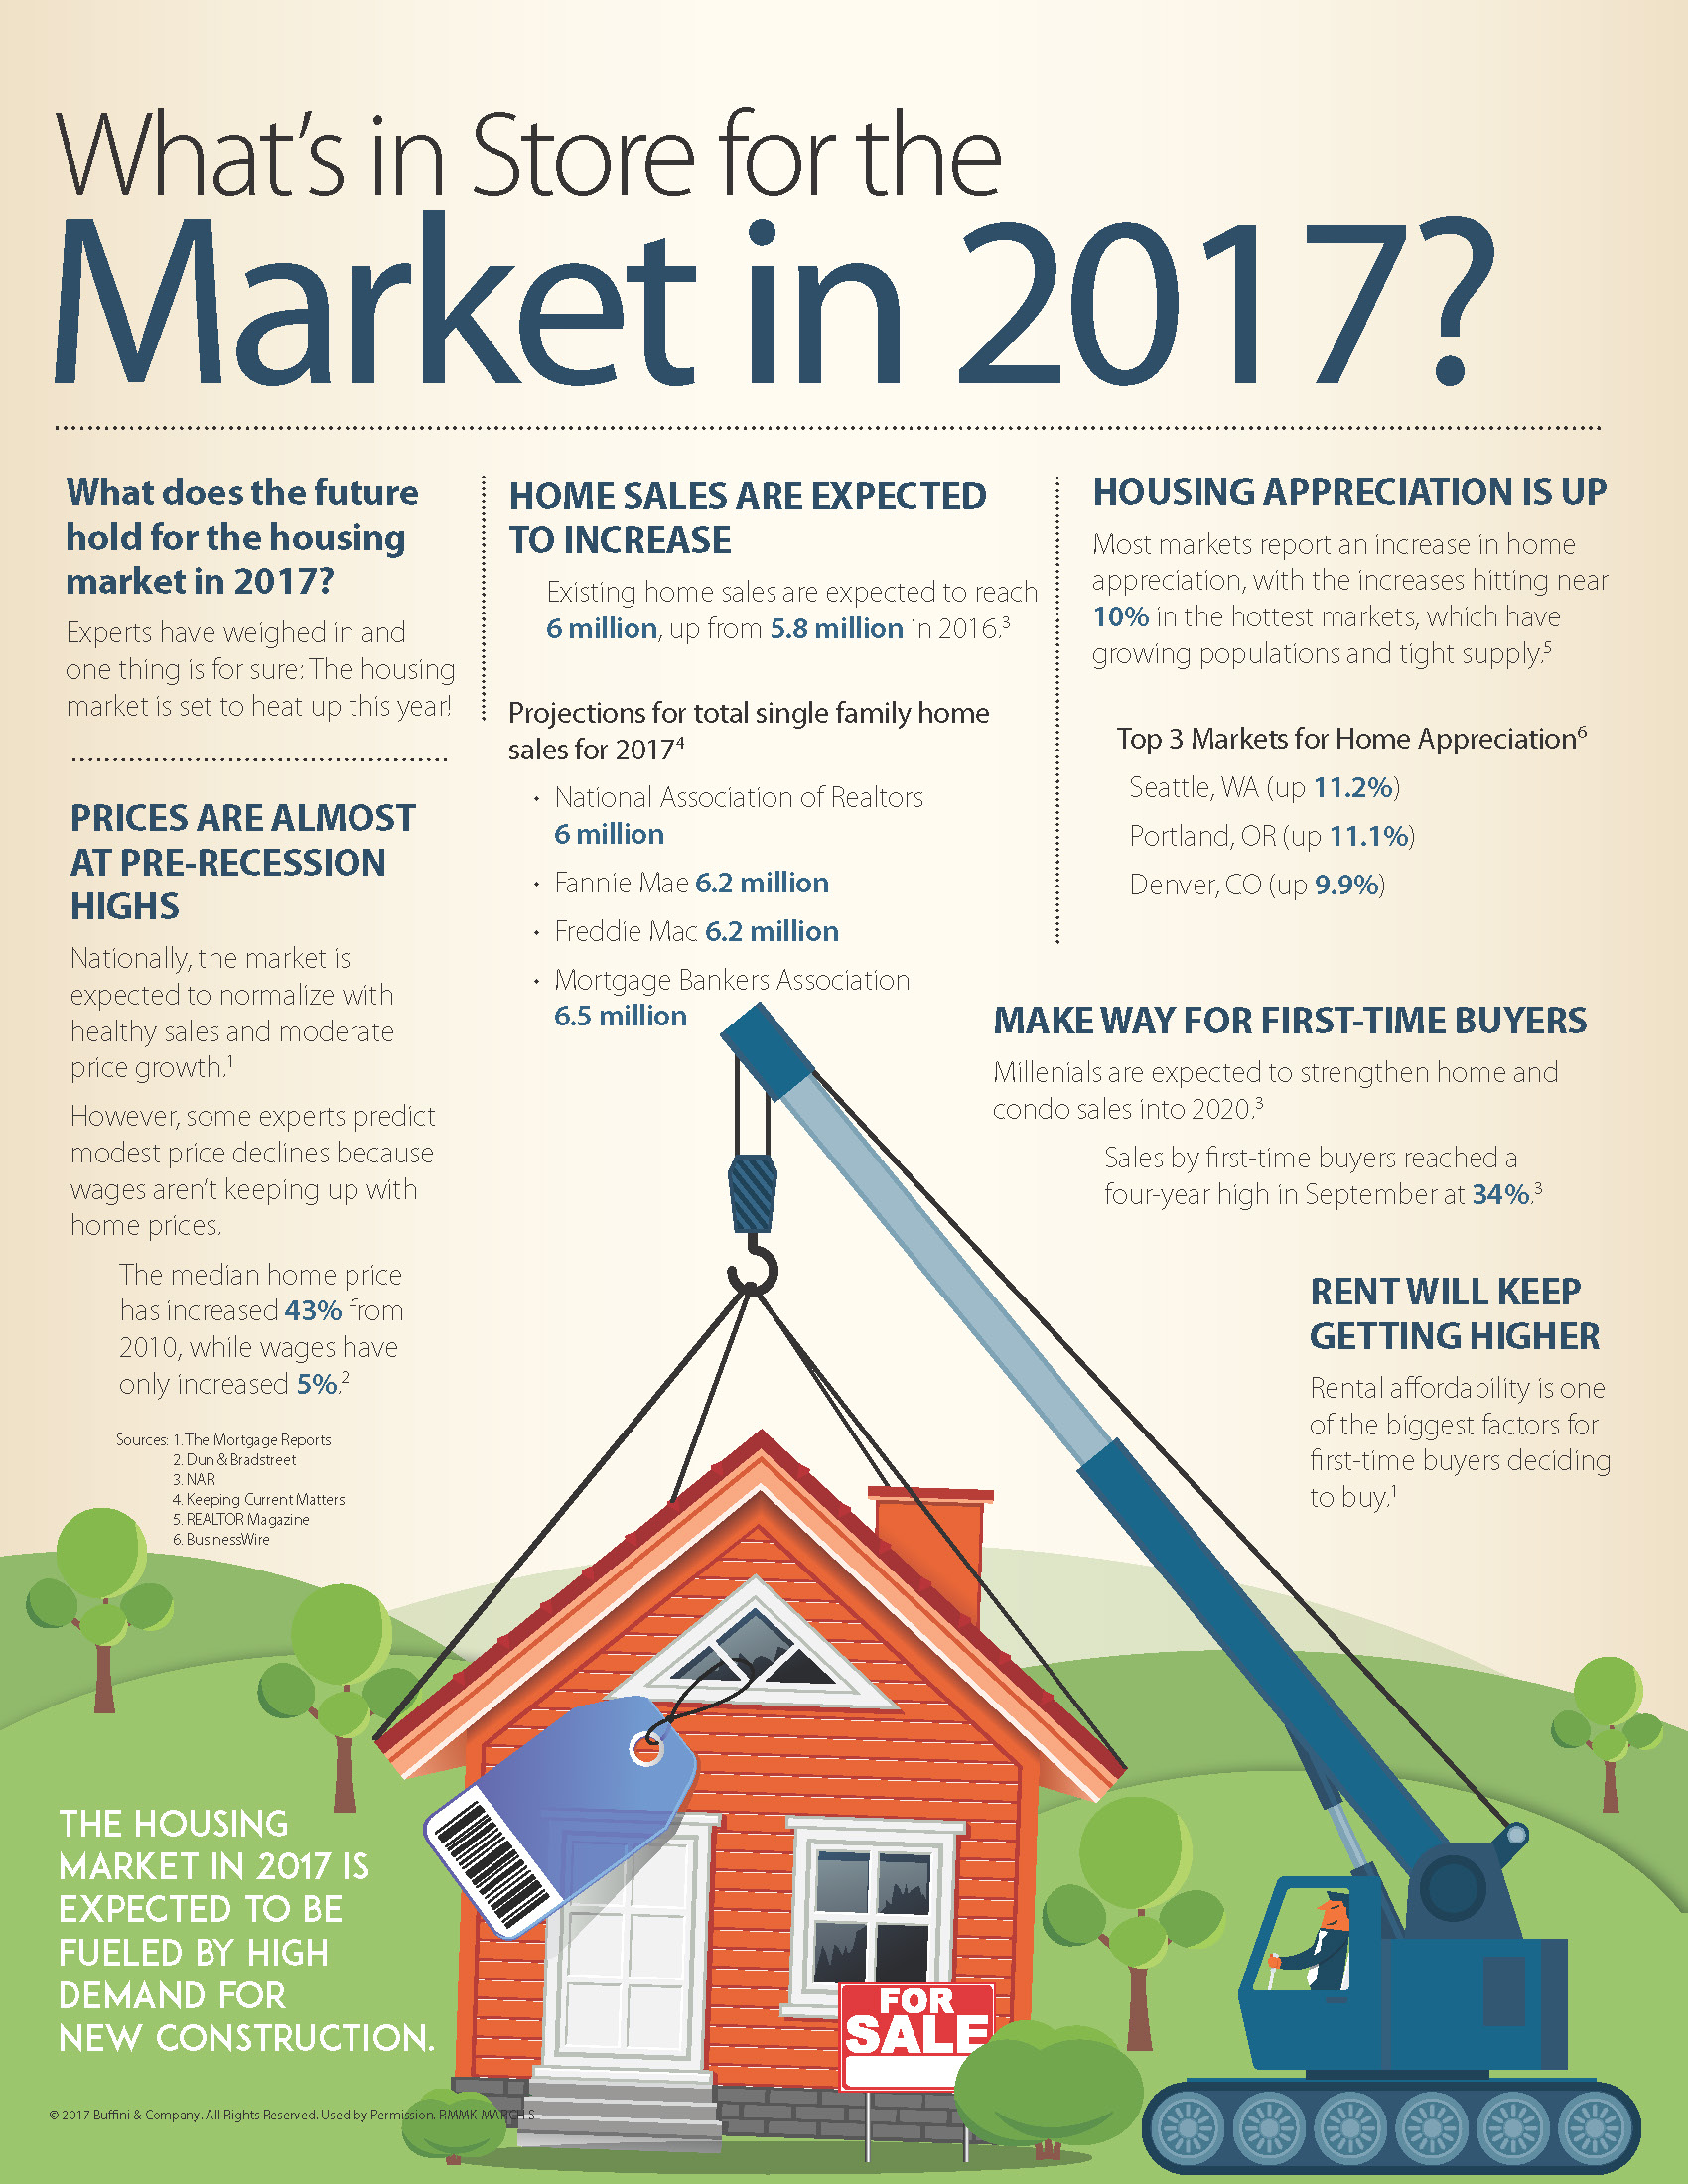
What will the market look like this year?

by Elite Asset Management Team

We’re a few months into the year and many potential buyers and sellers are wondering, is this a good year to get into the market? Many current homeowners are thinking about the value of their homes, even if they’re not thinking of listing anytime soon.

The information I’m sending this month provides an overview of what’s in store for the American real estate market this year based on expert predictions and current price and sales data. Please click here to view: What will the market look like this year? These forecasts provide insight into current trends and paint a picture of what may happen this year. Please note that this is an overall update of the national market, local and regional factors may play a role in specific forecasts for our market.

If you’d like to know more about our local market, want to know how much your home is worth or are thinking of buying or selling, give me a call. I’d love to discuss the market with you and assist you with all of your real estate needs.


FEBRUARY 2017 RE/MAX NATIONAL MARKET UPDATE

by Elite Asset Management Team

Home Sales In January Set Record Pace


DENVER – With the tug-of-war between rising home sales and shrinking inventory intensifying, January set records for the RE/MAX National Housing Report. Last month topped all other Januarys in the report’s nine-year history with the most sales, highest sales price and fewest days on market.
 
In the 53 metro areas surveyed, total sales were up 4.5% over January 2016, which was previously the January with the most sales. The Median Sales Price of $208,500 was up 4.3% and marked the 10th consecutive month of year-over-year price increases.
 
The new January low of 66 Days on Market underscores the fact that inventory has declined year-over-year for 99 consecutive months dating back to October 2008.
 
“January may have set the tone for the coming home-buying season with homes selling faster and at higher prices,”said Dave Liniger, RE/MAX CEO, Chairman of the Board and Co-Founder. “Home-buyer demand is strong, and not enough sellers are listing to keep up with the demand, despite rising prices. At any rate, the beginning of 2017 continued the strong pace of 2016.”
 
Closed Transactions 
Of the 53 metro areas surveyed in January 2017, the overall average number of home sales increased 4.5% compared to January 2016. Over two-thirds of the 53 metro areas experienced an increase in sales year-over-year, with 12 experiencing double-digit increases.  The markets with the largest increase in sales included Hartford, CT +21.6%, Seattle, WA +19.3%, Honolulu, HI +18.4%, Providence, RI +18.3% and Charlotte, NC +18.1%.
 
Median Sales Price – Median of 53 metro median prices
In January 2017, the median of all 53 metro Median Sales Prices was $208,500, down 3.0% from December 2016 but up 4.3% from January 2016. Only five metro areas saw year-over-year decreases or remained unchanged, with 10 rising by double-digit percentages. The largest double-digit increases were seen in Billings, MT +15.2%, Dallas/Ft. Worth, TX +14.1%, Birmingham, AL +13.7%, Cleveland, OH +13.6% and Portland, OR +13.2%.
 
Days on Market – Average of 53 metro areas
The average Days on Market for homes sold in January 2017 was 66, up four days from the average in December 2016, but down five days from the January 2016 average. The three metro areas with the lowest Days on Market were Omaha, NE at 38 and Denver, CO and San Francisco, CA both at 39. The highest Days on Market averages were in Augusta, ME at 141 and Chicago, IL at 99. Days on Market is the number of days between when a home is first listed in an MLS and a sales contract is signed. 
 
Months Supply of Inventory – Average of 53 metro areas
The number of homes for sale in January 2017 was down 4.3% from December 2016, and down 16.9% from January 2016. Based on the rate of home sales in January, the Months Supply of Inventory was 3.8, compared to December 2016 at 4.2 and January 2016 at 4.6. A 6.0-month supply indicates a market balanced equally between buyers and sellers. In January, 46 of the 53 metro areas surveyed reported a months supply of less than 6.0, which is typically considered a seller’s market. The remaining seven saw a months supply above 6.0, which is typically considered a buyer’s market. The markets with the lowest Months Supply of Inventory continued to be in the west, with both Denver, CO and Seattle, WA at 1.2 and San Francisco, CA at 1.4.


Displaying blog entries 1-4 of 4

Syndication

Categories

Archives

Contact Information

Photo of Elite Asset Management  Real Estate
Elite Asset Management
RE/MAX SELECT
8300 Carmel Ave. NE Ste. 203
Albuquerque NM 87122
(505)362-2005

zillow reviews