Real Estate Information Archive

Blog

Displaying blog entries 1-2 of 2

NAR: Pending Home Sales Slump 21.8% in April

by Elite Asset Management Team

April’s decline could be lowest point as Chief Economist expects market bounce back soon.


WASHINGTON (May 28, 2020) – Brought on by the coronavirus pandemic, pending home sales decreased in April, making two straight months of declines, according to the National Association of Realtors®. Every major region experienced a drop in month-over-month contract activity and a decline in year-over-year pending home sales transactions.


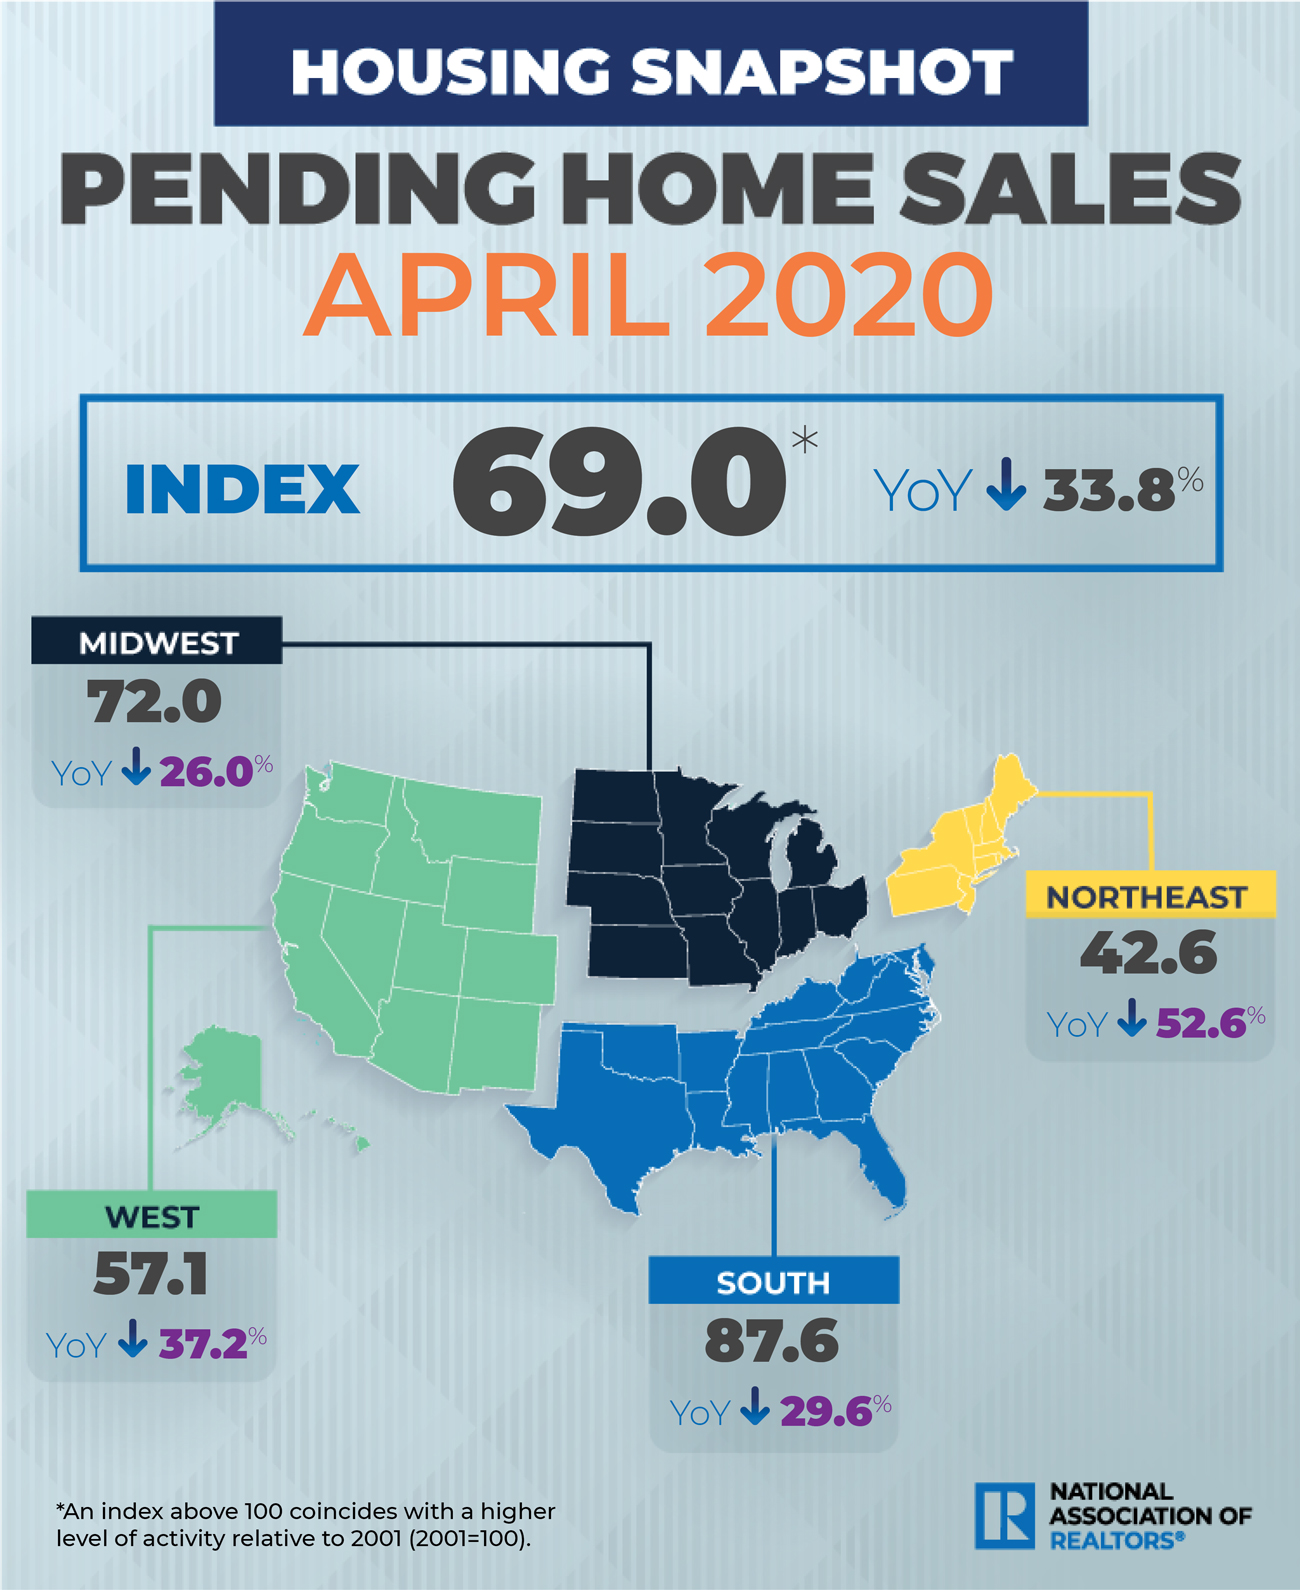
The Pending Home Sales Index (PHSI),* www.nar.realtor/pending-home-sales, a forward-looking indicator of home sales based on contract signings, fell 21.8% to 69.0 in April. Year-over-year, contract signings shrank 33.8%. An index of 100 is equal to the level of contract activity in 2001.


“With nearly all states under stay-at-home orders in April, it is no surprise to see the markedly reduced activity in signing contracts for home purchases,” said Lawrence Yun, NAR’s chief economist.


The latest pending home sales numbers reveal the greatest decline since NAR begin tracking such transactions in January 2001. However, Yun expects that April will be the lowest point for pending contracts, and the month of May, consequently, will be the lowest point for closed sales.


“While coronavirus mitigation efforts have disrupted contract signings, the real estate industry is ‘hot’ in affordable price points with the wide prevalence of bidding wars for the limited inventory,” he said. “In the coming months, buying activity will rise as states reopen and more consumers feel comfortable about homebuying in the midst of the social distancing measures.”


A sign that buyers’ comfortability may be growing is seen in NAR’s most recent Flash Survey, as 34% of Realtors® reported successfully completing nearly all aspects of transactions while adhering to social distancing procedures.


Pointing to data from realtor.com®, Yun says new listings were up in April 2020 from one year ago in 34 metro areas, including Virginia Beach, Va., Sioux Falls, S.D., Odessa, Texas, Summerville, Ga., and Las Cruces, N.M.


“Given the surprising resiliency of the housing market in the midst of the pandemic, the outlook for the remainder of the year has been upgraded for both home sales and prices, with home sales to decline by only 11% in 2020 with the median home price projected to increase by 4%,” Yun said. “In the prior forecast, sales were expected to fall by 15% and there was no increase in home price.”


Although each of the four indices is down on a month-over-month basis, an encouraging development is that the rates of declines are lower in the Midwest, South and West, compared to the drops seen in March 2020.


The Northeast PHSI sank 48.2% to 42.6 in April, 52.6% lower than a year ago. In the Midwest, the index dropped 15.9% to 72.0 last month, down 26.0% from April 2019.


Pending home sales in the South fell 15.4% to an index of 87.6 in April, a 29.6% decrease from April 2019. The index in the West slipped 20.0% in April 2020 to 57.1, down 37.2% from a year ago.


The National Association of Realtors® is America’s largest trade association, representing more than 1.4 million members involved in all aspects of the residential and commercial real estate industries.


Feel free to contact me and I can help break down exactly what these numbers mean for our local market and for your neighborhood. And lastly, If you or anyone you know is thinking of buying or selling a home - please call or email me. I'm here to help!

Peter Veres

Associate Broker,CRS,ABR,CLHMS,SRES

Elite Asset Management Team - RE/MAX Elite

www.PeteVeres.com

Cell: 505-362-2005

RE/MAX National Housing Report for April 2020

by Elite Asset Management Team

Pandemic Curbs Home Sales By 20% Year-Over-Year, Prices Remain Strong


DENVERMay 18, 2020 /PRNewswire/ -- Fewer sellers, fewer buyers: The first full month of coronavirus stay-at-home orders weighed on April home sales, causing them to drop an average of 20.2% compared to a year ago. Inventory in the report's 53 markets similarly tumbled by 20.5% year-over-year, while the Median Sale Price of $276,000 was up 9.3%.

Restrictions to prevent the spread of COVID-19 turned what is traditionally the year's fifth busiest month for home sales back to slumbering wintertime levels. Four markets –  New York, DetroitMiami and San Francisco – posted year-over-year sales declines of more than 40%. Just two markets – Minneapolis, MN and Billings, MT – reported an increase, while eight saw declines of less than 10%.

"April results were better than many expected, as consumers continued to buy and sell real estate in one of the most challenging months for housing in memory," said Adam Contos, RE/MAX CEO. "This was a headwind like no other – yet we still saw activity across the country. Even in the markets that dropped 40% in sales, people wanted or needed to move, which says something about resiliency and the power of homeownership."

Contos continued, "We believe the coronavirus and the measures to slow it pushed the spring selling season back a bit. But we believe buyer demand remains relatively strong despite the pandemic, and sellers who pulled their listings in March or April will hopefully come back into the market this summer. Others may start the process after being stuck in a home that no longer suits them. Both groups could help alleviate the inventory challenges we've faced for quite some time. Moving forward, agents who've adjusted their business strategies are positioned for success in the more virtual environment."

Like March, April is a transition month toward peak home sales in the summer. In a typical year, the busiest month is often May or June, with July and August being close behind.

Days on Market dropped seven days to 46 year over year, setting a new low for April in the report's 12-year history. By contrast, Months Supply of Inventory grew from 3.0 to 3.5.

The Median Sales Price of $276,000 also was a report record for April.

Closed Transactions 
Of the 53 metro areas surveyed in April 2020, the overall average number of home sales is down 13.7% compared to March 2020, and down 20.2% compared to April 2019. Only two metro areas, Billings, MT at +9.9% and Minneapolis, MN +3.6%, saw a year-over-year increase in Closed Transactions.

Median Sales Price – Median of 53 metro median prices
In April 2020, the median of all 53 metro Median Sales Prices was $276,000, up 4.2% from March 2020, and up 9.3% from April 2019. No metro areas saw a year-over-year decrease in Median Sales Price. Eighteen metro areas increased year-over-year by double-digit percentages, with the largest increases seen in Manchester, NH at +20.0%, Augusta, ME at +19.1%, and Philadelphia, PA at +16.9%.

Days on Market – Average of 53 metro areas
The average Days on Market for homes sold in April 2020 was 46, down eight days from the average in March 2020, and down seven days from the average in April 2019. The metro areas with the lowest Days on Market were Omaha, NE at 19, Seattle, WA at 20, and San Francisco, CA at 21. The highest Days on Market averages were in Des Moines, IA at 106, Augusta, ME at 95, and New York, NY at 88. Days on Market is the number of days between when a home is first listed in an MLS and a sales contract is signed.

Months Supply of Inventory – Average of 53 metro areas
The number of homes for sale in April 2020 was down 2.2% from March 2020 and down 18.2% from April 2019. Based on the rate of home sales in April 2020, the Months Supply of Inventory increased to 3.5 compared to 2.9 in March 2020, and increased compared to 3.0 in April 2019. A six months supply indicates a market balanced equally between buyers and sellers. In April 2020, of the 53 metro areas surveyed, five metro areas reported a months supply at or over six, which is typically considered a buyer's market. The markets with the lowest Months Supply of Inventory were Albuquerque, NM at 1.2, Omaha, NE at 1.3, and Manchester, NH at 1.4.

Feel free to contact me and I can help break down exactly what these numbers mean for our local market and for your neighborhood. And lastly, If you or anyone you know is thinking of buying or selling a home - please call or email me. I'm here to help!

Peter Veres

Associate Broker,CRS,ABR,CLHMS,SRES

Elite Asset Management Team - RE/MAX Elite

www.PeteVeres.com

Cell: 505-362-2005

Displaying blog entries 1-2 of 2

Syndication

Categories

Archives

Contact Information

Photo of Elite Asset Management  Real Estate
Elite Asset Management
RE/MAX SELECT
8300 Carmel Ave. NE Ste. 203
Albuquerque NM 87122
(505)362-2005

zillow reviews