


January 2018 RE/MAX National Housing Report
2017 Closes Strong, Record High December Home Prices
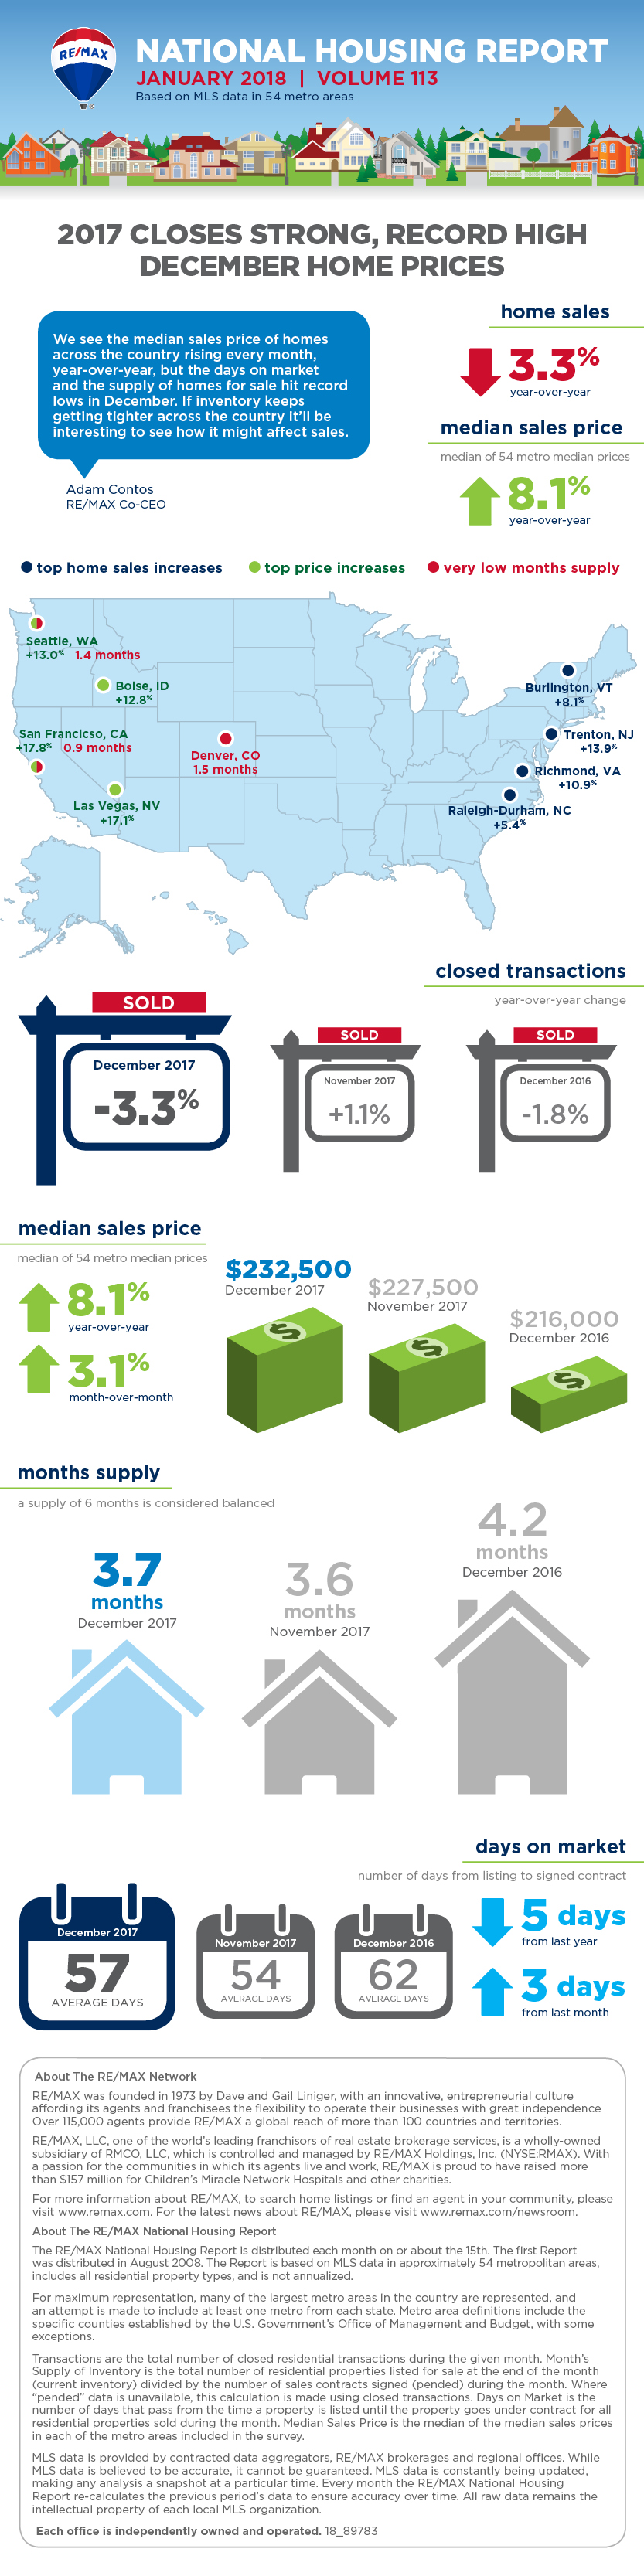
DENVER – While sales dropped slightly from a year ago, December capped off a 2017 of record home prices, speedy sales and low inventory.
The January RE/MAX National Housing Report shows the median home price rose 8.1% year-over-year, with 50 of the report’s 54 markets posting increases. At the same time, December sales dropped 3.3% from December 2016, with 39 markets reporting fewer transactions. Making sales harder was a Months Supply of Inventory of 3.7 which is the lowest December figure in the nine-year history of the report. That corresponds with a 14.6% decline in inventory, lengthening a streak of monthly declines that began in November 2008.
Also setting a report record for December was the speed of home sales: 57 days. That figured into an overall 2017 median for Days on Market of 52.5 — nearly a week less than the 2016 median of 58.5 days.
Home buyers paid record prices in 2017, led by June’s Median Price Sold of $245,000. Prices increased year-over-year in every month of 2017, with December marking the 21st consecutive month of year-over-year price increases dating back to April 2016.
“We see the median sales price of homes across the country rising every month, year-over-year, but the days on market and the supply of homes for sale hit record lows in December,” said Adam Contos, RE/MAX Co-CEO. “If inventory keeps getting tighter across the country it’ll be interesting to see how it might affect sales.”
Closed Transactions
Of the 54 metro areas surveyed in December 2017, the overall average number of home sales decreased 2.5% compared to November 2017 and decreased 3.3% compared to December 2016. Fifteen of the 54 metro areas experienced an increase in sales year-over-year including, Trenton, NJ, +13.9%, Richmond, VA, +10.9%, Burlington, VT, +8.1%, and Raleigh-Durham, NC, +5.4%.
Median Sales Price – Median of 54 metro median prices
In December 2017, the median of all 54 metro Median Sales Prices was $232,500, up 3.1% from November 2017 and up 8.1% from December 2016. Only four metro areas saw a year-over-year decrease in Median Sales Price; Anchorage, AK, -6.5%, Wichita, KS, -3.9%, Fargo, ND, -1.8% and Wilmington/Dover, DE, -.90%. Ten metro areas increased year-over-year by double-digit percentages, with the largest increases seen in San Francisco, CA, +17.8%, Las Vegas, NV, +17.1%, Seattle, WA, +13% and Boise, ID, +12.8%.
Days on Market – Average of 54 metro areas
The average Days on Market for homes sold in December 2017 was 57, up three days from the average in November 2017, and down five days from the December 2016 average. The four metro areas with the lowest Days on Market were Omaha, NE and San Francisco, CA, at 27, Nashville, TN, at 31 and Seattle, WA, at 34. The highest Days on Market averages were in Augusta, ME, at 122 and Chicago, IL, and Miami, FL, at 86. Days on Market is the number of days between when a home is first listed in an MLS and a sales contract is signed.
Months Supply of Inventory – Average of 54 metro areas
The number of homes for sale in December 2017 was down 14% from November 2017, and down 14.6% from December 2016. Based on the rate of home sales in December, the Months Supply of Inventory increased to 3.7 from November 2017 at 3.6, but decreased compared to December 2016 at 4.2. A 6.0-months supply indicates a market balanced equally between buyers and sellers. In December 2017, 52 of the 54 metro areas surveyed reported a months supply at or less than 6.0, which is typically considered a seller’s market. The metro areas that saw a months supply above 6.0, which is typically considered a buyer’s market, were Augusta, ME, at 9.5 and Miami, FL, at 8.7. The markets with the lowest Months Supply of Inventory continued to be in the west with San Francisco, CA, at 0.9, Seattle, WA, at 1.4, and Denver, CO, 1.5.
Feel free to contact me and I can help break down exactly what these numbers mean for our local market and for your neighborhood.
And lastly, If you or anyone you know is thinking of buying or selling a home - please call or email me. I'm here to help!
Peter Veres
Associate Broker, CRS,ABR,CLHMS,SRES
Elite Asset Management Team - RE/MAX Elite
www.PeteVeres.com
Cell: 505-362-2005
Office: 505-798-1000


