Real Estate Information

Elite Asset Management Team's Blog

Elite Asset Management Team

Blog

Displaying blog entries 21-30 of 240

RE/MAX National Housing Report for August 2020

by Elite Asset Management Team

Home Sales Sizzle Amid All-Time Low Inventory, Rising Prices


DENVERSept. 17, 2020 /PRNewswire/ -- The blistering hot streak of U.S. home sales continued in August, reaching record levels for the month. August also set new report records for lowest inventory and days on market as well as highest median sales price.


August home sales, continuing a torrid summer, were the highlight of the month. Year over year, home sales rose 4.3% and marked the third-highest total in the report's 13-year history covering 53 metro markets. July 2020 holds the report record for most home sales, followed by June 2017. Year to date, 2020 home sales trail 2019's by only 3% after being 9% lower through May.

"The demand for houses is easily eclipsing the available inventory in metro areas across the country. Buyers are moving forward in record numbers, unfazed by inventory challenges and consistently higher prices," said Adam Contos, CEO of RE/MAX Holdings, Inc. "Homeowners in a position to sell are seizing the opportunity – and benefiting from the one-two combination of enthusiastic, competitive buyers and significantly quicker turnaround times. In many respects, the current environment presents advantages on both sides of the equation."

While sales climbed, the number of homes on the market in August plunged 29.6% year-over-year – to an all-time report low. And in a related metric, the 1.7 Months of Inventory tied July for the lowest in report history.

This high-demand, low-supply dynamic drove the Median Sales Price to $290,000, topping the previous report record of $285,000 set just one month ago in July. Prices rose 11.5% from August 2019, the highest year-over-year increase in more than six years.

On average, homes spent a mere 41 Days on Market – tying July 2018 for the shortest time in report history. Fourteen markets reported 30 days or less from listing to contract signing. Compare that to August 2019, when average Days on Market totaled 45.

Closed Transactions 
Of the 53 metro areas surveyed in August 2020, the overall average number of home sales is down 7.6% compared to July 2020, and up 4.3% compared to August 2019.  Leading the year-over-year sales percentage increase were Chicago, IL at +20.1%, Boise, ID at +15.7%, and Hartford, CT at +15.2%.

Median Sales Price – Median of 53 metro median prices
In August 2020, the median of all 53 metro Median Sales Prices was $290,000, up 1.8% from July 2020, and up 11.5% from August 2019.  Thirty metro areas increased year-over-year by double-digit percentages, led by Augusta, ME at +22.8%, Tulsa, OK at +21.8%, and Cincinnati, OH at +18.3%. Not a single metro area saw a year-over-year decrease in Median Sales Price.

Days on Market – Average of 53 metro areas
The average Days on Market for homes sold in August 2020 was 41, down three days from the average in July 2020, and down four days from the average in August 2019. The metro areas with the lowest Days on Market were Omaha, NE at 17, Cincinnati, OH at 21, and a tie between Seattle, WA and Nashville, TN at 22. The highest Days on Market averages were in Des Moines, IA at 92, Miami, FL at 89, and New York, NY at 83. Days on Market is the number of days between when a home is first listed in an MLS and a sales contract is signed.

Months Supply of Inventory – Average of 53 metro areas
The number of homes for sale in August 2020 was down 6.1% from July 2020 and down 29.6% from August 2019. Based on the rate of home sales in August 2020, the Months Supply of Inventory decreased to 1.7 compared to 1.9 in July 2020, and decreased compared to 3.3 in August 2019. The markets with the lowest Months Supply of Inventory were Boise, ID at 0.5, Albuquerque, NM at 0.7, and a seven-way tie between Hartford, CTPhoenix, AZCharlotte, NCManchester, NHWashington DCDenver, CO, and Omaha, NE at 0.9.

Feel free to contact me and I can help break down exactly what these numbers mean for our local market and for your neighborhood. And lastly, If you or anyone you know is thinking of buying or selling a home - please call or email me. I'm here to help!

Peter Veres

Associate Broker,CRS,ABR,CLHMS,SRES

Elite Asset Management Team - RE/MAX Elite

www.PeteVeres.com

Cell: 505-362-2005

RE/MAX National Housing Report for July 2020

by Elite Asset Management Team

July Home Sales Jump 8.7% Despite Low Inventory, Ending Recent Skid


DENVER, Aug. 19, 2020 /PRNewswire/ -- In a significant upward shift, July home sales rose 8.7% over July 2019, halting a streak of year-over-year sales declines triggered by the COVID-19 pandemic. July's market was blistering hot despite the lowest Months Supply of Inventory (1.7 months) in the 12-year history of the report.


July set a report record for most home sales in any month among the report's 53 metro markets. Seven months into 2020, home sales are just 4.8% below 2019, compared to the end of May when the year-to-date total was 8.9% behind last year's pace. Surprisingly, 2020 monthly sales have exceeded 2019 in four out of seven months thus far.


"The sharp gain in home sales in July – which was the best month of home sales in our report's history – is further evidence of housing's remarkable recovery amidst the pandemic," said Adam Contos, RE/MAX Holdings CEO. "Home sales typically peak in May or June, but this year we're seeing an overlap of the spring and summer markets. And, as strong as July was, sales may have been even higher if inventory hadn't been so tight."


Continued Contos: "Buyers have returned to the market more quickly than sellers, likely spurred on by historically low interest rates and coronavirus-inspired lifestyle changes. Home is the center of life in 2020, and the pandemic has caused people to reconsider their living situations – especially with so many people working from home. So far, buyers have shown they are willing to pay steadily increasing prices, so the months ahead could be very active, especially if more homeowners decide to jump in and sell."


Finding a home to buy remains the biggest challenge for many. July inventory dropped 30.1% from July 2019, a report record, and was the ninth consecutive month of double-digit declines year over year. The only three months with lower inventory totals were two winters ago: December 2017 and January and February 2018.


July's 1.7 Months of Inventory marked only the second month in report history with below 2 months supply. Even with year-over-year declines factored in, housing inventory is typically at its highest during the summer months.


July's Median Sales Price of $285,000 is up 8.6% year-over-year. This is in line with pre-pandemic rises in price after smaller year-over-year price increases of 4.7% and 1.9% in May and June, respectively. Days on Market averaged 44, an increase from 43 the previous July.


Closed Transactions

Of the 53 metro areas surveyed in July 2020, the overall average number of home sales is up 18.6% compared to June 2020, and up 8.7% compared to July 2019.  Leading the year-over-year sales percentage increase were Pittsburgh, PA at +25.9%, Des Moines, IA at +25.2%, and Denver, CO at +22.3%.


Median Sales Price – Median of 53 metro median prices

In July 2020, the median of all 53 metro Median Sales Prices was $285,000, up 3.4% from June 2020, and up 8.6% from July 2019. Only one metro area, Honolulu, HI at -4.0%, saw a year-over-year decrease in Median Sales Price. Twenty-two metro areas increased year-over-year by double-digit percentages, led by Birmingham, AL at +17.1%, Augusta, ME at +14.1%, and Indianapolis, IN at +14.0%.


Days on Market – Average of 53 metro areas

The average Days on Market for homes sold in July 2020 was 44, down one day from the average in June 2020, and up one day from the average in July 2019. The metro areas with the lowest Days on Market were Omaha, NE at 20, Cincinnati, OH at 24, and Seattle, WA at 25. The highest Days on Market averages were in Des Moines, IA at 94, Augusta, ME at 91, and Miami, FL at 90. Days on Market is the number of days between when a home is first listed in an MLS and a sales contract is signed.


Months Supply of Inventory – Average of 53 metro areas

The number of homes for sale in July 2020 was down 6.2% from June 2020 and down 30.1% from July 2019. Based on the rate of home sales in July 2020, the Months Supply of Inventory decreased to 1.7 compared to 2.1 in June 2020 and decreased compared to 3.2 in July 2019. A six months supply indicates a market balanced equally between buyers and sellers. In July 2020, of the 53 metro areas surveyed, zero metro areas reported a months supply at or over six, which is typically considered a buyer's market. The markets with the lowest Months Supply of Inventory were a two-way tie between Albuquerque, NM and Boise, ID at 0.7, and a four-way tie among Hartford, CT, Phoenix, AZ, Manchester, NH, and Washington DC at 0.9.


Feel free to contact me and I can help break down exactly what these numbers mean for our local market and for your neighborhood. And lastly, If you or anyone you know is thinking of buying or selling a home - please call or email me. I'm here to help!

Peter Veres

Associate Broker,CRS,ABR,CLHMS,SRES

Elite Asset Management Team - RE/MAX Elite

www.PeteVeres.com

Cell: 505-362-2005


RE/MAX National Housing Report for June 2020

by Elite Asset Management Team

Home Sales Post Near-Record Turnaround Despite Inventory Constraints


DENVERJuly 17, 2020 /PRNewswire/ -- RE/MAX, LLC announced today June home sales posted a near-record 37% gain over a pandemic-impacted May while Months Supply of Inventory dropped below two months for the first time in the report's 12-year history.


Overall, U.S. home sales returned to near seasonal levels – just 6.9% lower than last June, which was the third-highest sales month of 2019. All of the report's 53 metro markets posted gains over May and a third of them topped last June. The June results were far different than those of May and April, which both reflected widespread stay-at-home mandates in many states.

"June home sales snapped back in a major way," said Adam Contos, RE/MAX Holdings CEO. "With historically low interest rates, stabilizing unemployment and increased mobility tied to working remotely, buyer demand remains high in most areas of the country. We're seeing positives in several leading indicators such as pending sales and mortgage applications.

"The biggest challenge continues to be lack of inventory, and over time we may see some gains around people wanting a different living environment after spending so much time at home this year. There's also some potential in the idea that with changing workplace dynamics, underused commercial spaces could be transformed into residential properties. Creative solutions like that may provide some relief for inventory constraints as well as affordability issues." 

The 37% increase in sales from May to June was the third-highest month-over-month turnaround in the report's history. The 12-year average for May-to-June sales increases is 8.4%.

Going in the opposite direction, inventory dropped 27.9% year over year, pushing the Months Supply of Inventory to 1.9 from the previous report low of 2.7 months set in May. The number of homes for sale is at low levels not seen consistently since early 2018.

June's Median Sales Price of $275,000 is up 1.9% year over year, the lowest year-over-year price increase of any month since December 2018's 0.4% price drop.

Days on Market averaged 45, the same as the previous June.

Closed Transactions 
Of the 53 metro areas surveyed in June 2020, the overall average number of home sales is up 37% compared to May 2020, and down 6.9% compared to June 2019.  Leading the year-over-year sales percentage increase were Tulsa, OK at +15.9%, Little Rock, AR at +14.6%, and Dallas/Ft Worth, TX at +9.3%.

Median Sales Price – Median of 53 metro median prices
In June 2020, the median of all 53 metro Median Sales Prices was $275,000, up 0.8% from May 2020, and up 1.9% from June 2019. Only one metro area, Des Moines, IA at -1.3%, saw a year-over-year decrease in Median Sales Price. Two metro areas increased year-over-year by double-digit percentages: Miami, FL at +11.1% and Indianapolis, IN at +10.0%.

Days on Market – Average of 53 metro areas
The average Days on Market for homes sold in June 2020 was 45, down one day from the average in May 2020, and equivalent to the average in June 2019. The metro areas with the lowest Days on Market were Omaha, NE at 22, Cincinnati, OH at 23, and Seattle, WA at 25. The highest Days on Market averages were in Des Moines, IA at 90, Miami, FL at 88, and New York, NY at 85. Days on Market is the number of days between when a home is first listed in an MLS and a sales contract is signed.

Months Supply of Inventory – Average of 53 metro areas
The number of homes for sale in June 2020 was down 5.3% from May 2020 and down 27.9% from June 2019. Based on the rate of home sales in June 2020, the Months Supply of Inventory decreased to 1.9 compared to 2.7 in May 2020, and decreased compared to 3.2 in June 2019. A six months supply indicates a market balanced equally between buyers and sellers. In June 2020, of the 53 metro areas surveyed, zero metro areas reported a months supply at or over six, which is typically considered a buyer's market. The markets with the lowest Months Supply of Inventory were Manchester, NH at 0.7, and a tie between Albuquerque, NM and Boise, ID at 0.8.

Feel free to contact me and I can help break down exactly what these numbers mean for our local market and for your neighborhood. And lastly, If you or anyone you know is thinking of buying or selling a home - please call or email me. I'm here to help!

Peter Veres

Associate Broker,CRS,ABR,CLHMS,SRES

Elite Asset Management Team - RE/MAX Elite

www.PeteVeres.com

Cell: 505-362-2005

RE/MAX National Housing Report for May 2020

by Elite Asset Management Team

DENVERJune 17, 2020 /PRNewswire/ -- May, often the second-strongest month for home sales, saw what many believe may be the biggest housing impact from the pandemic as closings dropped 33.7% compared to last year.

All 53 markets in the report sustained double-digit year-over-year sales declines:


  • Sales in four markets shrunk by more than half, led by Detroit's drop of 64.8%
  • Eighteen markets saw sales drop by one-fourth to one-third
  • Des Moines's sales decline of 14.3% was the smallest

While the Median Sales Price of $272,000 was up 4.7%, it was softer than the 5.4% average May-to-May price increase in the previous five years.

Inventory dropped 25% year-over-year to one of the lowest levels for May in the report's 12-year history. Only Indianapolis (12.7%), Wichita (4.3%) and Chicago (1%) posted increases in the number of homes for sale compared to May 2019.

With May being the second full month under stay-at-home mandates in many states, home sales were the lowest for the month since 2012, and on a par with wintertime home-sales activity. Compare that to 2017, 2018 and 2019, when May posted the highest or second-highest home sales of the year. June typically sees the year's most home sales and highest Median Sales Price.

"Not surprisingly, May sales were historically muted alongside increasingly pinched inventory as the full brunt of the pandemic likely manifested itself during the month," said Adam Contos, CEO of RE/MAX Holdings, Inc. "However, as the local outlook across the country increasingly pivoted to how soon stay-at-home restrictions might end, multiple leading indicators in the U.S. housing market have turned positive, some even on a year-over-year basis."

Contos continued, "We believe the spring selling season was largely deferred for several weeks. And, with home being the center of people's lives this year, we could see the effect of pent-up demand play out in a significant way. Absent another major coronavirus wave, inventory levels and the unemployment rate may well be the governors on how strong the housing market performs this year."

The average Days on Market of 46 and the 2.5 Months Supply of Inventory both tied report records for May, set in 2018.

Closed Transactions 
Of the 53 metro areas surveyed in May 2020, the overall average number of home sales is down 3.9% compared to April 2020, and down 33.7% compared to May 2019.  All 53 metro areas saw a year-over-year decrease in closed transactions. The metro areas with the lowest year-over-year decreases were Des Moines, IA at -14.3%, Little Rock, AR at -15.5%, and Richmond, VA at -15.6%.

Median Sales Price – Median of 53 metro median prices
In May 2020, the median of all 53 metro Median Sales Prices was $272,000, down 1.0% from April 2020, and up 4.7% from May 2019. Five metro areas saw a year-over-year decrease in Median Sales Price, with the largest decreases in Detroit, MI at -2.9%, Burlington, VT at -1.3%, and Houston, TX at -0.7%. Three metro areas increased year-over-year by double-digit percentages, Manchester, NH at +11.9%, New York, NY at +10.8%, and Miami, FL at +10.0%.

Days on Market – Average of 53 metro areas
The average Days on Market for homes sold in May 2020 was 46, equal to the average in April 2020, and down two days from the average in May 2019. The metro areas with the lowest Days on Market were Seattle, WA at 22, Cincinnati, OH at 24, and Nashville, TN at 25. The highest Days on Market averages were in Miami, FL at 103, Des Moines, IA at 96, and Burlington, VT at 91. Days on Market is the number of days between when a home is first listed in an MLS and a sales contract is signed.

Months Supply of Inventory – Average of 53 metro areas
The number of homes for sale in May 2020 was down 4.0% from April 2020 and down 25.0% from May 2019. Based on the rate of home sales in May 2020, the Months Supply of Inventory decreased to 2.5 compared to 3.7 in April 2020, and decreased compared to 3.0 in May 2019. A six months supply indicates a market balanced equally between buyers and sellers. In May 2020, of the 53 metro areas surveyed, four metro areas reported a months supply at or over six, which is typically considered a buyer's market. Those four markets were Indianapolis, IN at 6.4, Miami, FL at 6.9, New Orleans, LA at 6.1, and New York, NY at 9.6. The markets with the lowest Months Supply of Inventory were Albuquerque, NM at 0.9, Omaha, NE at 1.0, and a three-way tie between Charlotte, NCManchester, NH, and Denver, CO at 1.1.

Feel free to contact me and I can help break down exactly what these numbers mean for our local market and for your neighborhood. And lastly, If you or anyone you know is thinking of buying or selling a home - please call or email me. I'm here to help!

Peter Veres

Associate Broker,CRS,ABR,CLHMS,SRES

Elite Asset Management Team - RE/MAX Elite

www.PeteVeres.com

Cell: 505-362-2005

NAR: Pending Home Sales Slump 21.8% in April

by Elite Asset Management Team

April’s decline could be lowest point as Chief Economist expects market bounce back soon.


WASHINGTON (May 28, 2020) – Brought on by the coronavirus pandemic, pending home sales decreased in April, making two straight months of declines, according to the National Association of Realtors®. Every major region experienced a drop in month-over-month contract activity and a decline in year-over-year pending home sales transactions.


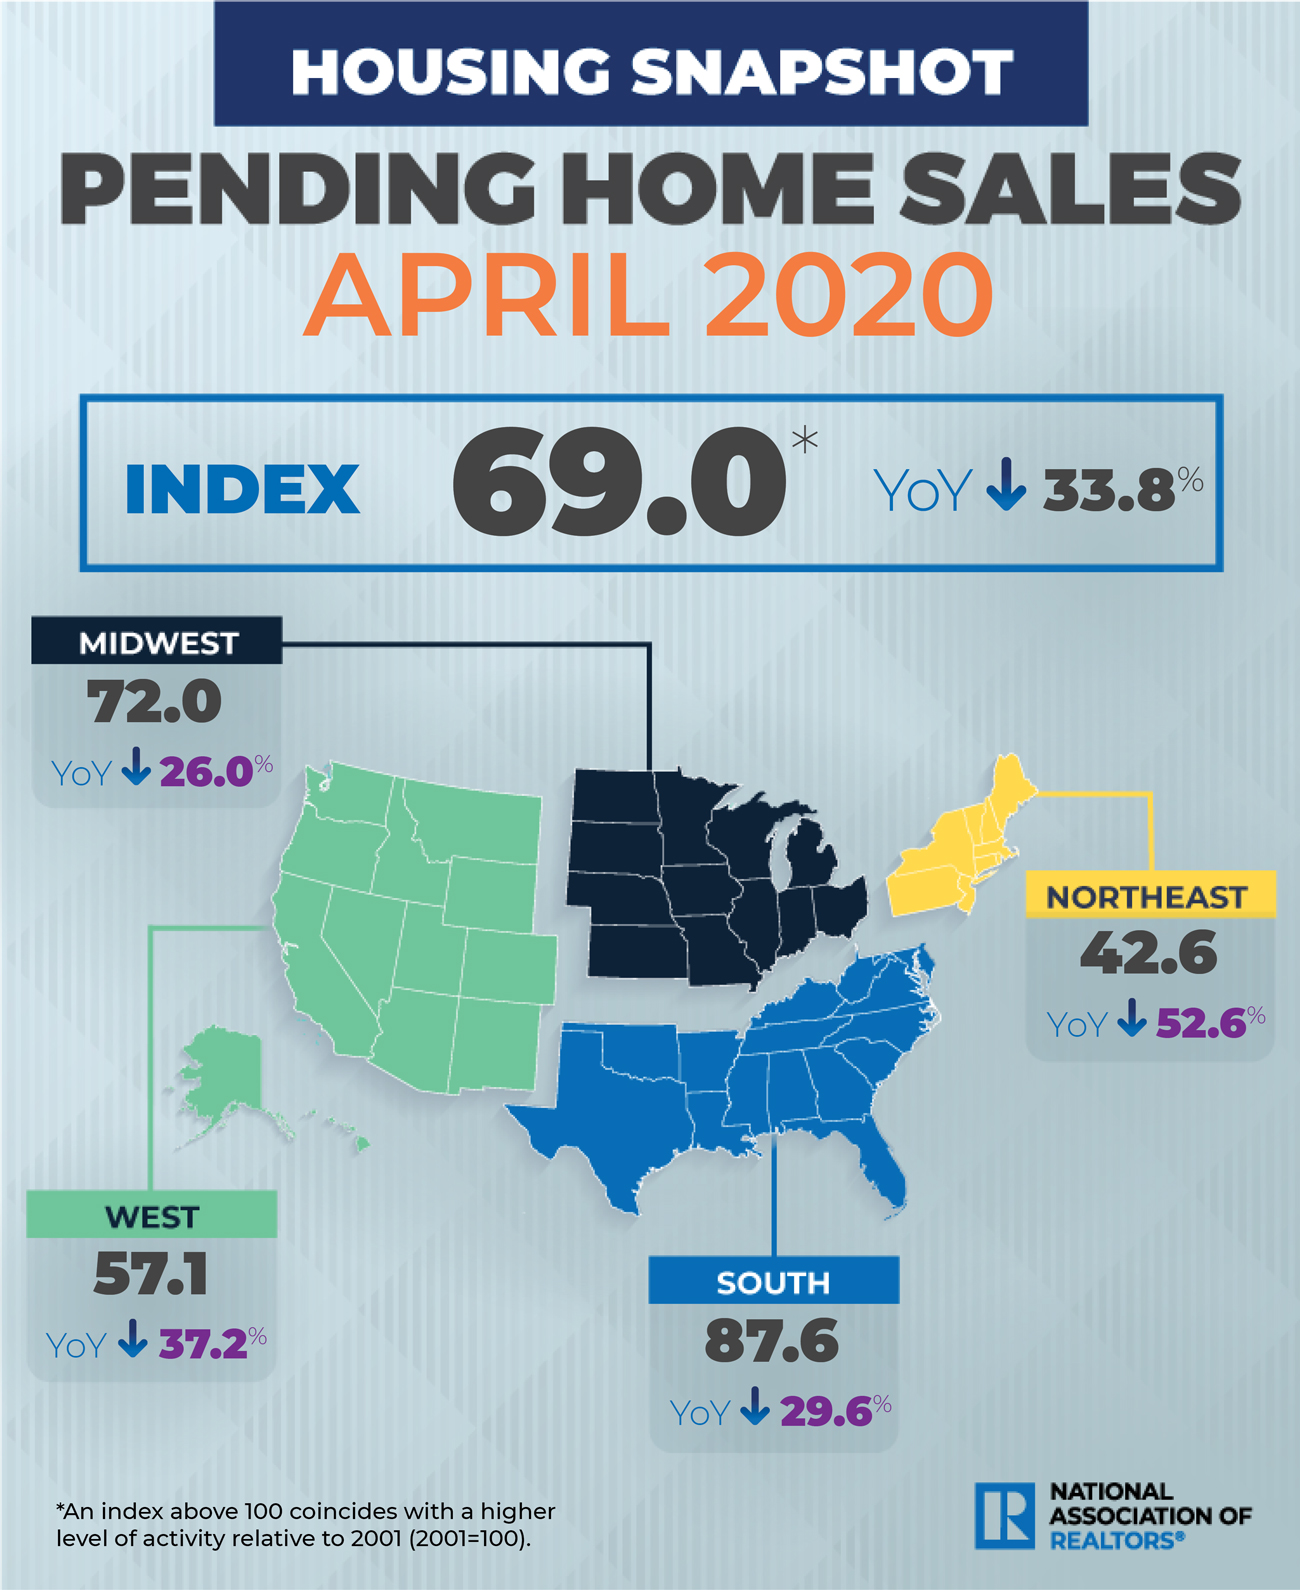
The Pending Home Sales Index (PHSI),* www.nar.realtor/pending-home-sales, a forward-looking indicator of home sales based on contract signings, fell 21.8% to 69.0 in April. Year-over-year, contract signings shrank 33.8%. An index of 100 is equal to the level of contract activity in 2001.


“With nearly all states under stay-at-home orders in April, it is no surprise to see the markedly reduced activity in signing contracts for home purchases,” said Lawrence Yun, NAR’s chief economist.


The latest pending home sales numbers reveal the greatest decline since NAR begin tracking such transactions in January 2001. However, Yun expects that April will be the lowest point for pending contracts, and the month of May, consequently, will be the lowest point for closed sales.


“While coronavirus mitigation efforts have disrupted contract signings, the real estate industry is ‘hot’ in affordable price points with the wide prevalence of bidding wars for the limited inventory,” he said. “In the coming months, buying activity will rise as states reopen and more consumers feel comfortable about homebuying in the midst of the social distancing measures.”


A sign that buyers’ comfortability may be growing is seen in NAR’s most recent Flash Survey, as 34% of Realtors® reported successfully completing nearly all aspects of transactions while adhering to social distancing procedures.


Pointing to data from realtor.com®, Yun says new listings were up in April 2020 from one year ago in 34 metro areas, including Virginia Beach, Va., Sioux Falls, S.D., Odessa, Texas, Summerville, Ga., and Las Cruces, N.M.


“Given the surprising resiliency of the housing market in the midst of the pandemic, the outlook for the remainder of the year has been upgraded for both home sales and prices, with home sales to decline by only 11% in 2020 with the median home price projected to increase by 4%,” Yun said. “In the prior forecast, sales were expected to fall by 15% and there was no increase in home price.”


Although each of the four indices is down on a month-over-month basis, an encouraging development is that the rates of declines are lower in the Midwest, South and West, compared to the drops seen in March 2020.


The Northeast PHSI sank 48.2% to 42.6 in April, 52.6% lower than a year ago. In the Midwest, the index dropped 15.9% to 72.0 last month, down 26.0% from April 2019.


Pending home sales in the South fell 15.4% to an index of 87.6 in April, a 29.6% decrease from April 2019. The index in the West slipped 20.0% in April 2020 to 57.1, down 37.2% from a year ago.


The National Association of Realtors® is America’s largest trade association, representing more than 1.4 million members involved in all aspects of the residential and commercial real estate industries.


Feel free to contact me and I can help break down exactly what these numbers mean for our local market and for your neighborhood. And lastly, If you or anyone you know is thinking of buying or selling a home - please call or email me. I'm here to help!

Peter Veres

Associate Broker,CRS,ABR,CLHMS,SRES

Elite Asset Management Team - RE/MAX Elite

www.PeteVeres.com

Cell: 505-362-2005

RE/MAX National Housing Report for April 2020

by Elite Asset Management Team

Pandemic Curbs Home Sales By 20% Year-Over-Year, Prices Remain Strong


DENVERMay 18, 2020 /PRNewswire/ -- Fewer sellers, fewer buyers: The first full month of coronavirus stay-at-home orders weighed on April home sales, causing them to drop an average of 20.2% compared to a year ago. Inventory in the report's 53 markets similarly tumbled by 20.5% year-over-year, while the Median Sale Price of $276,000 was up 9.3%.

Restrictions to prevent the spread of COVID-19 turned what is traditionally the year's fifth busiest month for home sales back to slumbering wintertime levels. Four markets –  New York, DetroitMiami and San Francisco – posted year-over-year sales declines of more than 40%. Just two markets – Minneapolis, MN and Billings, MT – reported an increase, while eight saw declines of less than 10%.

"April results were better than many expected, as consumers continued to buy and sell real estate in one of the most challenging months for housing in memory," said Adam Contos, RE/MAX CEO. "This was a headwind like no other – yet we still saw activity across the country. Even in the markets that dropped 40% in sales, people wanted or needed to move, which says something about resiliency and the power of homeownership."

Contos continued, "We believe the coronavirus and the measures to slow it pushed the spring selling season back a bit. But we believe buyer demand remains relatively strong despite the pandemic, and sellers who pulled their listings in March or April will hopefully come back into the market this summer. Others may start the process after being stuck in a home that no longer suits them. Both groups could help alleviate the inventory challenges we've faced for quite some time. Moving forward, agents who've adjusted their business strategies are positioned for success in the more virtual environment."

Like March, April is a transition month toward peak home sales in the summer. In a typical year, the busiest month is often May or June, with July and August being close behind.

Days on Market dropped seven days to 46 year over year, setting a new low for April in the report's 12-year history. By contrast, Months Supply of Inventory grew from 3.0 to 3.5.

The Median Sales Price of $276,000 also was a report record for April.

Closed Transactions 
Of the 53 metro areas surveyed in April 2020, the overall average number of home sales is down 13.7% compared to March 2020, and down 20.2% compared to April 2019. Only two metro areas, Billings, MT at +9.9% and Minneapolis, MN +3.6%, saw a year-over-year increase in Closed Transactions.

Median Sales Price – Median of 53 metro median prices
In April 2020, the median of all 53 metro Median Sales Prices was $276,000, up 4.2% from March 2020, and up 9.3% from April 2019. No metro areas saw a year-over-year decrease in Median Sales Price. Eighteen metro areas increased year-over-year by double-digit percentages, with the largest increases seen in Manchester, NH at +20.0%, Augusta, ME at +19.1%, and Philadelphia, PA at +16.9%.

Days on Market – Average of 53 metro areas
The average Days on Market for homes sold in April 2020 was 46, down eight days from the average in March 2020, and down seven days from the average in April 2019. The metro areas with the lowest Days on Market were Omaha, NE at 19, Seattle, WA at 20, and San Francisco, CA at 21. The highest Days on Market averages were in Des Moines, IA at 106, Augusta, ME at 95, and New York, NY at 88. Days on Market is the number of days between when a home is first listed in an MLS and a sales contract is signed.

Months Supply of Inventory – Average of 53 metro areas
The number of homes for sale in April 2020 was down 2.2% from March 2020 and down 18.2% from April 2019. Based on the rate of home sales in April 2020, the Months Supply of Inventory increased to 3.5 compared to 2.9 in March 2020, and increased compared to 3.0 in April 2019. A six months supply indicates a market balanced equally between buyers and sellers. In April 2020, of the 53 metro areas surveyed, five metro areas reported a months supply at or over six, which is typically considered a buyer's market. The markets with the lowest Months Supply of Inventory were Albuquerque, NM at 1.2, Omaha, NE at 1.3, and Manchester, NH at 1.4.

Feel free to contact me and I can help break down exactly what these numbers mean for our local market and for your neighborhood. And lastly, If you or anyone you know is thinking of buying or selling a home - please call or email me. I'm here to help!

Peter Veres

Associate Broker,CRS,ABR,CLHMS,SRES

Elite Asset Management Team - RE/MAX Elite

www.PeteVeres.com

Cell: 505-362-2005

RE/MAX National Housing Report for March 2020

by Elite Asset Management Team


Strong Q1 Start for Home Sales Slowed by COVID-19 Pandemic

DENVER – Despite the advance of the coronavirus across the U.S. in the second half of the month, March home sales increased 2.7% year-over-year in the report’s 52 markets – a hint of what might have been.

 March was the fourth consecutive month with year-over-year increases in U.S. home sales – a streak not seen since 2016. But the spread of COVID-19, and the initiation of governmental measures to slow it, dampened the month’s overall sales results:

• March’s year-over-year sales growth of less than 3% was significantly less than December 2019 through February 2020 where year-over-year sales increases averaged 10%.

• The sequential monthly growth in sales from February to March is typically the largest month-over-month percentage increase each year, averaging 32%. This year, March sales increased just 23.8% over February – the lowest such increase for this time period in the report’s nearly 12-year history.

 Inventory levels in March continued to constrict amid healthy buyer interest, which helped drive further price increases. Year-over-year, March inventory declined 14.9%, continuing a streak that began in July 2019. Meanwhile, the Median Sales Price of $265,000 was 7.7% higher than a year ago, setting a report record for the month of March. A record low for March was the 54 Days on Market, while 2.7 Months Supply of Inventory was typical for the month, based on the past four years.

 “As expected, the strong market of January and February continued into March, setting up a very good first quarter. But then the coronavirus and the initial mitigation measures arrived, disrupting our industry along with everything else,” said Adam Contos, RE/MAX Holdings, Inc. CEO. “Conditions and restrictions vary throughout the country, so some areas continue to see new listings, pendings and closings, while other markets have slowed dramatically – especially where real estate was not deemed an essential service. It’s a fluid situation. We believe that interest in buying or selling remains high, and pent up-demand in many places should drive sales higher over time.”

 Added Contos, “One takeaway that’s already clear is that real estate agents, using technology and adhering to social distancing guidelines, can lead consumers through the buying or selling process in a largely virtual way. In many respects, the expertise of a skilled agent has never been more important.”

Closed Transactions

Of the 52 metro areas surveyed in March 2020, the overall average number of home sales was up 23.8% compared to February 2020, and up 2.7% compared to March 2019. Leading the year-over-year sales percentage increase were Los Angeles, CA at +15.6%, Boise, ID at +15.2%, and Las Vegas, NV at +12.2%.

Median Sales Price – Median of 52 metro median prices

In March 2020, the median of all 52 metro Median Sales Prices was $265,000, up 2.9% from February 2020 and up 7.7% from March 2019. Only one metro area, Billings, MT at -0.4%, saw a year-over-year decrease in Median Sales Price. Seventeen metro areas increased year-over-year by double-digit percentages, with the largest increases seen in Birmingham, AL at +19.8%, Cincinnati, OH at +14.3%, and Salt Lake City, UT at +14.1%.

Days on Market – Average of 52 metro areas

The average Days on Market for homes sold in March 2020 was 54, down five days from the average in February 2020, and down five days from the average in March 2019. The metro areas with the lowest Days on Market were San Francisco, CA at 25, and a two-way tie between Seattle, WA and Omaha, NE at 30. The highest Days on Market averages were in Augusta, ME at 128, Des Moines, IA at 112, and Hartford, CT at 94. Days on Market is the number of days between when a home is first listed in an MLS and a sales contract is signed.

Months Supply of Inventory – Average of 52 metro areas

The number of homes for sale in March 2020 was up 1.1% from February 2020 and down 14.9% from March 2019. Based on the rate of home sales in March 2020, the Months Supply of Inventory decreased to 2.7 compared to 3.0 in February 2020, and decreased compared to 3.2 in March 2019. A six months supply indicates a market balanced equally between buyers and sellers. In March 2020, of the 52 metro areas surveyed, two metro areas reported a months supply at or over six, which is typically considered a buyer’s market. The markets with the lowest Months Supply of Inventory were Manchester, NH at 1.2, and a six-way tie among Boise, ID, Washington DC, Denver, CO, Seattle, WA, Omaha, NE, and San Francisco, CA at 1.3.

Feel free to contact me and I can help break down exactly what these numbers mean for our local market and for your neighborhood. And lastly, If you or anyone you know is thinking of buying or selling a home - please call or email me. I'm here to help!

Peter Veres

Associate Broker,CRS,ABR,CLHMS,SRES

Elite Asset Management Team - RE/MAX Elite

www.PeteVeres.com

Cell: 505-362-2005

The Economic Impact of Buying a Home

by Elite Asset Management Team


We’re in a changing real estate market, and life, in general, is changing too – from how we grocery shop and meal prep to the ways we can interact with our friends and neighbors. Even practices for engaging with agents, lenders, and all of the players involved in a real estate transaction are changing to a virtual format. What isn’t changing, however, is one key thing that can drive the local economy: buying a home.


We’re all being impacted in different ways by the effects of the coronavirus. If you’re in a position to buy a home today, know that you’re a major economic force in your neighborhood. And while we all wait patiently for the current pandemic to pass, there are a lot of things you can do in the meantime to keep your home search on track.


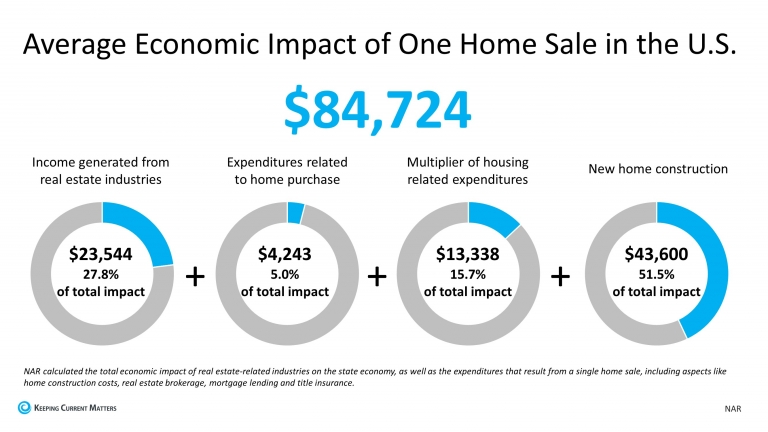
Every year the National Association of Realtors (NAR) shares a report that notes the full economic impact of home sales. This report summarizes:


“The total economic impact of real estate related industries on the state economy, as well as the expenditures that result from a single home sale, including aspects like home construction costs, real estate brokerage, mortgage lending and title insurance.”


Here’s the breakdown of how the average home sale boosts the economy:


When you buy a home, you’re making an impact. You’re fulfilling your need for shelter and a place to live, and you’re also generating jobs and income for the appraiser, the loan officer, the title company, the real estate agent, and many more contributors to the process. For every person or business that you work with throughout the transaction, there’s also likely a team behind the scenes making it all happen, so the effort multiplies substantially. As noted above in the circle on the right, the impact is almost double when you purchase new construction, given the extra labor it requires to build the home.


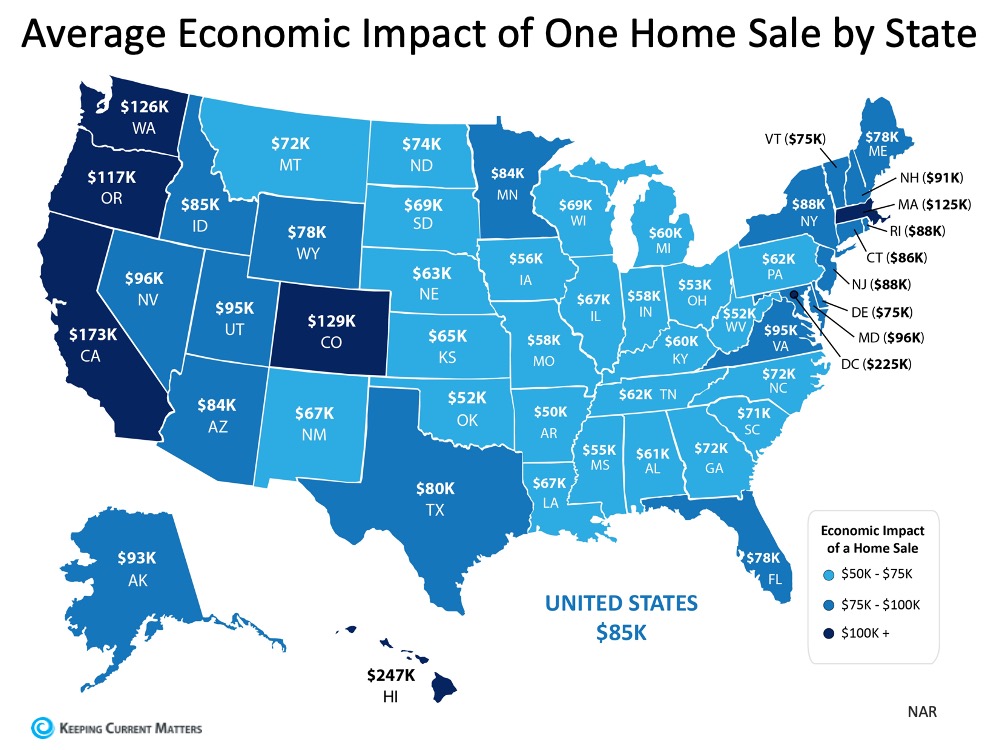
The report also breaks down the average economic impact by state:


As a buyer, you have an essential need for a home – and you can make an essential impact with homeownership, too. That need for shelter, comfort, and a safe place to live will always be alive and well. And whenever you’re able to act on that need, whether now or later, you’ll truly be creating gains for you, your family, local business professionals, and the overall economy.


Bottom Line

Whenever you purchase a home, you’re an economic driver. Even if you’re not ready or able to make a move now, there are things you can do to keep your own process moving forward so you’re set when the time is right for you. Reach out to local real estate professional and ABR – Accredited Buyers Representative Pete Veres to help you track the market and set up your specific home search. Pete can be reached at 505-362-2005. See what Pete’s clients are saying about him at www.TopAbqAgentReviews.com

What You Can Do to Keep Your Dream of Homeownership Moving Forward

by Elite Asset Management Team


Some Highlights:

Don’t put your homeownership plans on hold just because you’re stuck inside.

There are several things you can do right now to keep your home search moving forward.

Now is an excellent time to buy as rates are down.

We having also implemented some great virtual resources and are keeping everyone’s safety in mind.

Connect with an accredited buyer’s agent, ABR such as Pete Veres. Pete is one of the Top Agents in Albuquerque. Check out what clients are saying about him at www.TopAbqAgentReviews.com Call him at 505-362-2005 to learn about our current market conditions. Pete can also offer you a free Loan Pre-Approval with one of the best lenders in Albuquerque.

RE/MAX National Housing Report for February 2020

by Elite Asset Management Team


DENVER, March 18, 2020 /PRNewswire/ -- Representing the last full month before the coronavirus became a global pandemic, February saw the third consecutive month of year-over-year increases in U.S. home sales – a streak not seen since 2015. At the same time, inventory across the report's 53 metro markets plunged 15.8%, marking the fourth successive month of double-digit percentage, year-over-year declines.


"Strong February home sales and limited inventory defined U.S. housing ahead of the challenges brought on by the coronavirus emergency," said Adam Contos, CEO of RE/MAX Holdings, Inc. "Even as we all adjust to the new landscape of social distancing and limited in-person interaction, houses will continue to be bought and sold. Overall, demand in February was high, inventory remains low, and interest rates are attractive, but exact circumstances vary by community. Professional agents – the local experts – can offer tremendous value right now, providing clarity and expert guidance in an environment that's new for everyone and changing every day."


Before the coronavirus struck the U.S. on a large scale, home sales in February – which enjoyed an extra weekend day for Leap Year – increased 7.5% year over year, following strong increases of 13.5% and 10.5% in December and January. The previous streak of increasing year-over-year sales of three months or longer began in December 2015 and continued seven months into June 2016. That was also a period of large inventory declines, like the current stretch of year-over-year drops in inventory that is now at eight months.


February's Median Sales Price of $260,000 posted a year-over-year increase of 7.9% - the 14th consecutive month where home prices have shot up.


In the nearly 12-year history of the report, three February records were set last month:


Fewest Months Supply of Inventory: 2.8

Fewest Days on Market: 60

Highest Median Sales Price: $260,000

Closed Transactions

Of the 53 metro areas surveyed in February 2020, the overall average number of home sales is up 7.4% compared to January 2020, and up 7.5% compared to February 2019.  Leading the year-over-year sales percentage increase were Los Angeles, CA at +32.2%, Las Vegas, NV at +28.0%, and Billings, MT at +20.1%.


Median Sales Price – Median of 53 metro median prices

In February 2020, the median of all 53 metro Median Sales Prices was $260,000, up 2.0% from January 2020, and up 7.9% from February 2019. Fifteen metro areas increased year-over-year by double-digit percentages, with the largest increases seen in Birmingham, AL at +16.5%, Augusta, ME at +14.5%, and Milwaukee, WI at +13.9%. Three metro areas saw a year-over-year decrease in Median Sales Price, with the largest decrease seen in Billings, MT at -5.2%.


Days on Market – Average of 53 metro areas

The average Days on Market for homes sold in February 2020 was 60, up one day from the average in January 2020, and down two days from the average in February 2019. The metro areas with the lowest Days on Market were Omaha, NE at 28, and a two-way tie between Nashville, TN and San Francisco, CA at 34. The highest Days on Market averages were in Des Moines, IA at 119, Augusta, ME at 112, and Hartford, CT at 97. Days on Market is the number of days between when a home is first listed in an MLS and a sales contract is signed.


Months Supply of Inventory – Average of 53 metro areas

The number of homes for sale in February 2020 was down 2.6% from January 2020 and down 15.8% from February 2019. Based on the rate of home sales in February 2020, the Months Supply of Inventory decreased to 2.8 compared to 3.2 in January 2020, and decreased compared to 4.1 in February 2019. A six months supply indicates a market balanced equally between buyers and sellers. In February 2020, of the 53 metro areas surveyed, four metro areas reported a months supply at or over six, which is typically considered a buyer's market. The markets with the lowest Months Supply of Inventory were Denver, CO and Seattle, WA, both at 1.1, and a four-way tie at 1.2.

Feel free to contact me and I can help break down exactly what these numbers mean for our local market and for your neighborhood. And lastly, If you or anyone you know is thinking of buying or selling a home - please call or email me. I'm here to help!

Peter Veres

Associate Broker,CRS,ABR,CLHMS,SRES

Elite Asset Management Team - RE/MAX Elite

www.PeteVeres.com

Cell: 505-362-2005

Displaying blog entries 21-30 of 240

Syndication

Categories

Archives

Contact Information

Photo of Elite Asset Management  Real Estate
Elite Asset Management
RE/MAX SELECT
8300 Carmel Ave. NE Ste. 203
Albuquerque NM 87122
(505)362-2005

zillow reviews