SEPTEMBER 2016 RE/MAX NATIONAL MARKET UPDATE
Home Sales Cool, Price Increases Moderate
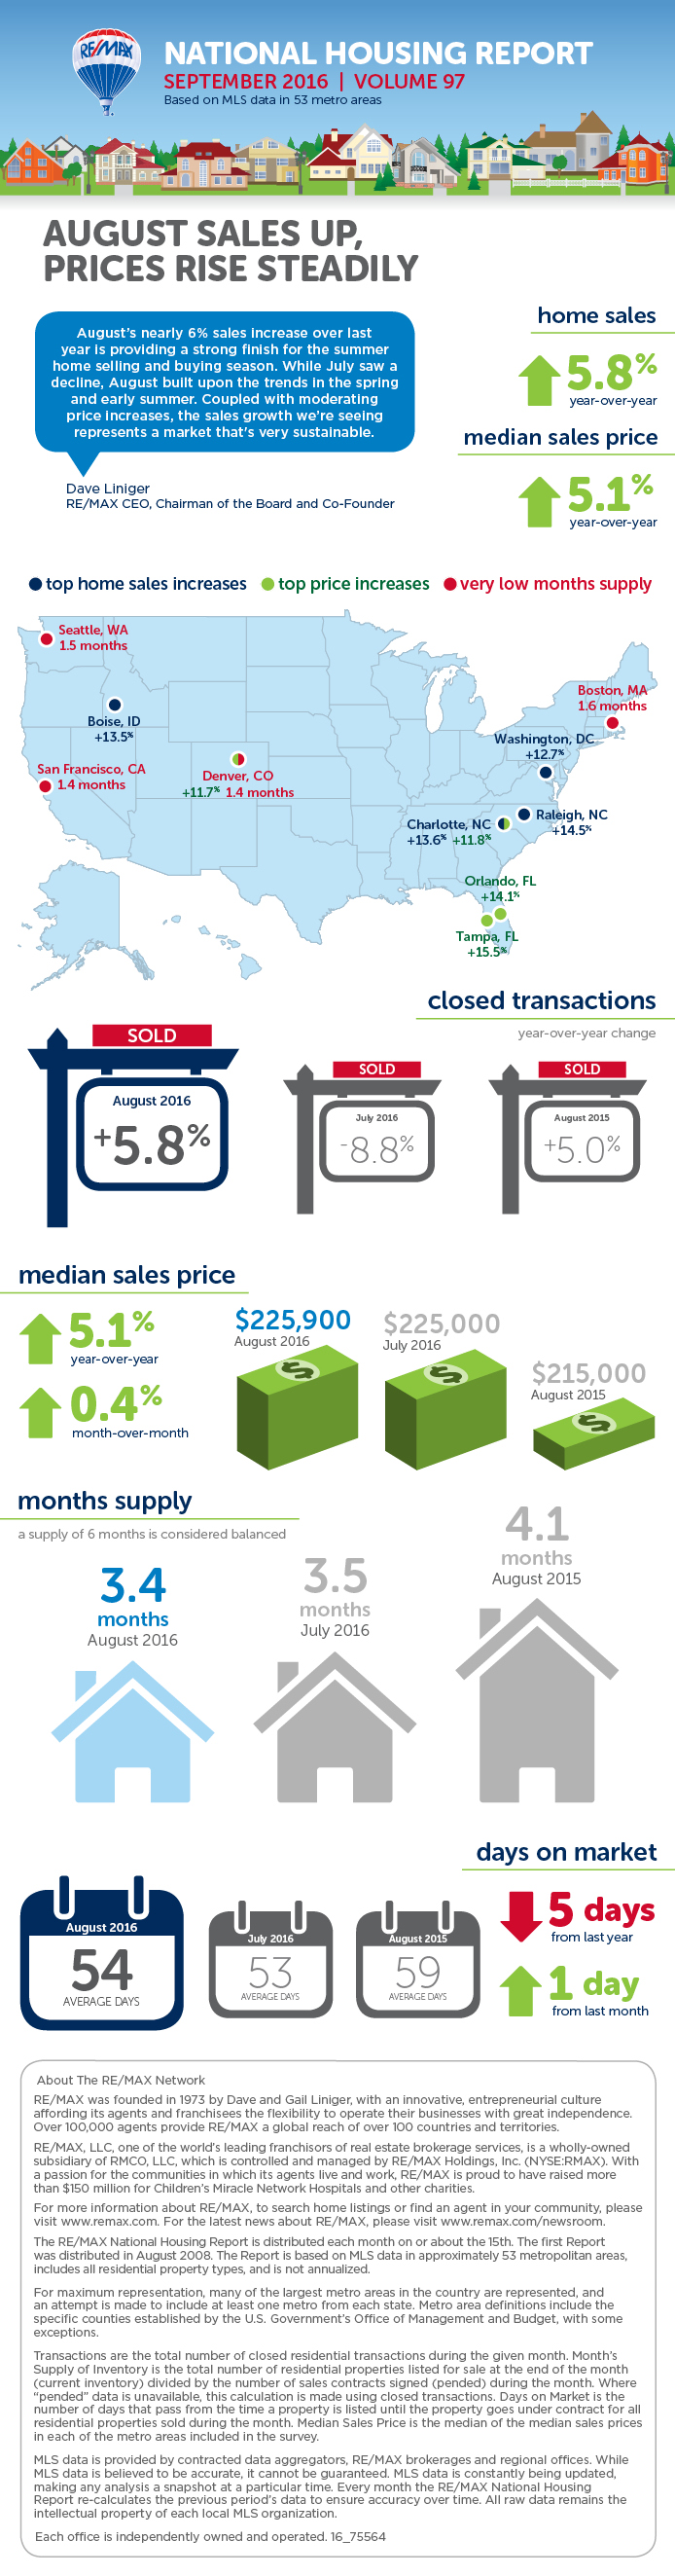
DENVER (August 19, 2016) – Unlike the month’s temperatures, July home sales cooled off from June’s highest year-to-date level. In the RE/MAX National Housing Report analysis of 53 U.S. cities, July sales fell in 49 markets by 8.8% from July 2015 and by 13.1% from June. Over the last seven years, the average drop in sales from June to July has been 8.2%. The Median Sales Price dropped slightly from June to $225,000, which is still 4.7% higher than one year ago. At the same time, inventory continued to tighten by dropping 3.0% lower than June and 16.6% lower than a year ago, resulting in a Months Supply of just 3.5. Five metro areas reported an inventory supply of less than two months. Meanwhile, the average Days on Market dropped to 53 which is just one day less than the average in June and four days below last year.
“After a June jump in home sales, it's quite common to see July sales make a correction. This is a summertime pattern that we often see on a national level. Of course, one month doesn't make a trend and we still have a couple more months ahead in the traditional home-buying season. At the same time, it's important to note that, on a year-over-year basis, prices are rising at a moderate rate that's very much in line with historical averages," said Dave Liniger, RE/MAX CEO, Chairman of the Board and Co-Founder.
“One of the most important things for consumers to realize is just how regionalized housing truly is. While those on the West coast are being surprised by their high appraisals, homeowners in the Northeast and Midwest are more likely to be shocked by their low values. If homeowners keep an eye on local home sales, they can be better aware of their current home value and not be shocked when they go to sell or refinance,” added Bob Walters, Quicken Loans, Chief Economist.
Closed Transactions – Year-over-year change
In the 53 metro areas surveyed in July, the average number of home sales was 8.8% lower than one year ago, and was 13.1% lower than the previous month. It’s not unusual to see a midsummer slowdown in sales. Over the last seven years, the average drop in sales from June to July has been 8.2%. Despite the trend, four metro areas surveyed reported sales higher than one year ago, including Providence, RI +3.7%, Boise, ID +2.1%, Raleigh-Durham, NC +1.4%, and Albuquerque, NM +0.2%.
Median Sales Price – Median of 53 metro median prices
In July, the median of all 53 metro Median Sales Prices was $225,000, down 1.3% from June 2016, but up 4.7% from the Median Sales Price in July 2015. July is the 54th consecutive month without a drop in price from the previous year. The 4.7% increase in prices continues this year’s trend of moderating price increases. Among the 53 metro areas surveyed in July, only three had a year-over-year drop in Median Sales Price. Two metro areas reported numbers that were unchanged and the remaining 48 metros reported higher prices than one year ago, with ten rising by double-digit percentages, including Honolulu, HI +14.8%, Orlando, FL +14.4%, Nashville, TN +14.0%, Tampa, FL +13.0%, Denver, CO +12.2% and Portland, OR +11.3%.
Days on Market – Average of 53 metro areas
The average Days on Market for all homes sold in July was 53, down one day from the average of 54 in June 2016, and down four days from the average of 57 in July 2015. July 2016 was the 40th consecutive month with a Days on Market average of 80 or less. In the four markets with the lowest inventory supply, Denver, Seattle, San Francisco and Omaha, Days on Market was 21, 23, 24 and 24 respectively. The highest Days on Market averages were seen in Augusta, ME at 130, down from 142 in June, and Des Moines, IA at 90, down from 102 in June. Days on Market is the number of days between when a home is first listed in an MLS and a sales contract is signed.
Month’s Supply of Inventory – Average of 53 metro areas
The number of homes for sale in July was 3.0% lower than in June, and 16.6% lower than in July 2015. Based on the rate of home sales in July, the Months Supply of Inventory was 3.5, which is close to last month and last year, 3.2 and 3.9 respectively. A six-month supply indicates a market balanced equally between buyers and sellers. The number of metros with a Months Supply of Inventory below 2.0 may also be stabilizing at five, down from eight in June. The five metros with less than a two-month supply include Denver, CO 1.4, Seattle, WA 1.4, San Francisco, CA 1.5, Portland, OR 1.8 and Omaha, NE 1.9.
Feel free to contact me and I can help break down exactly what these numbers mean for our local market and for your neighborhood.
And lastly, If you or anyone you know is thinking of buying or selling a home - please call or email me. I'm here to help!
Peter Veres
Associate Broker, CRS,ABR,CLHMS,SRES
Elite Asset Management Team - RE/MAX Elite
www.PeteVeres.com
Cell: 505-362-2005
Office: 505-798-1000