Real Estate Information Archive

Blog

Displaying blog entries 1-3 of 3

OCTOBER 2016 RE/MAX NATIONAL MARKET UPDATE

by Elite Asset Management Team

Homebuyer Demand Remains Strong in September


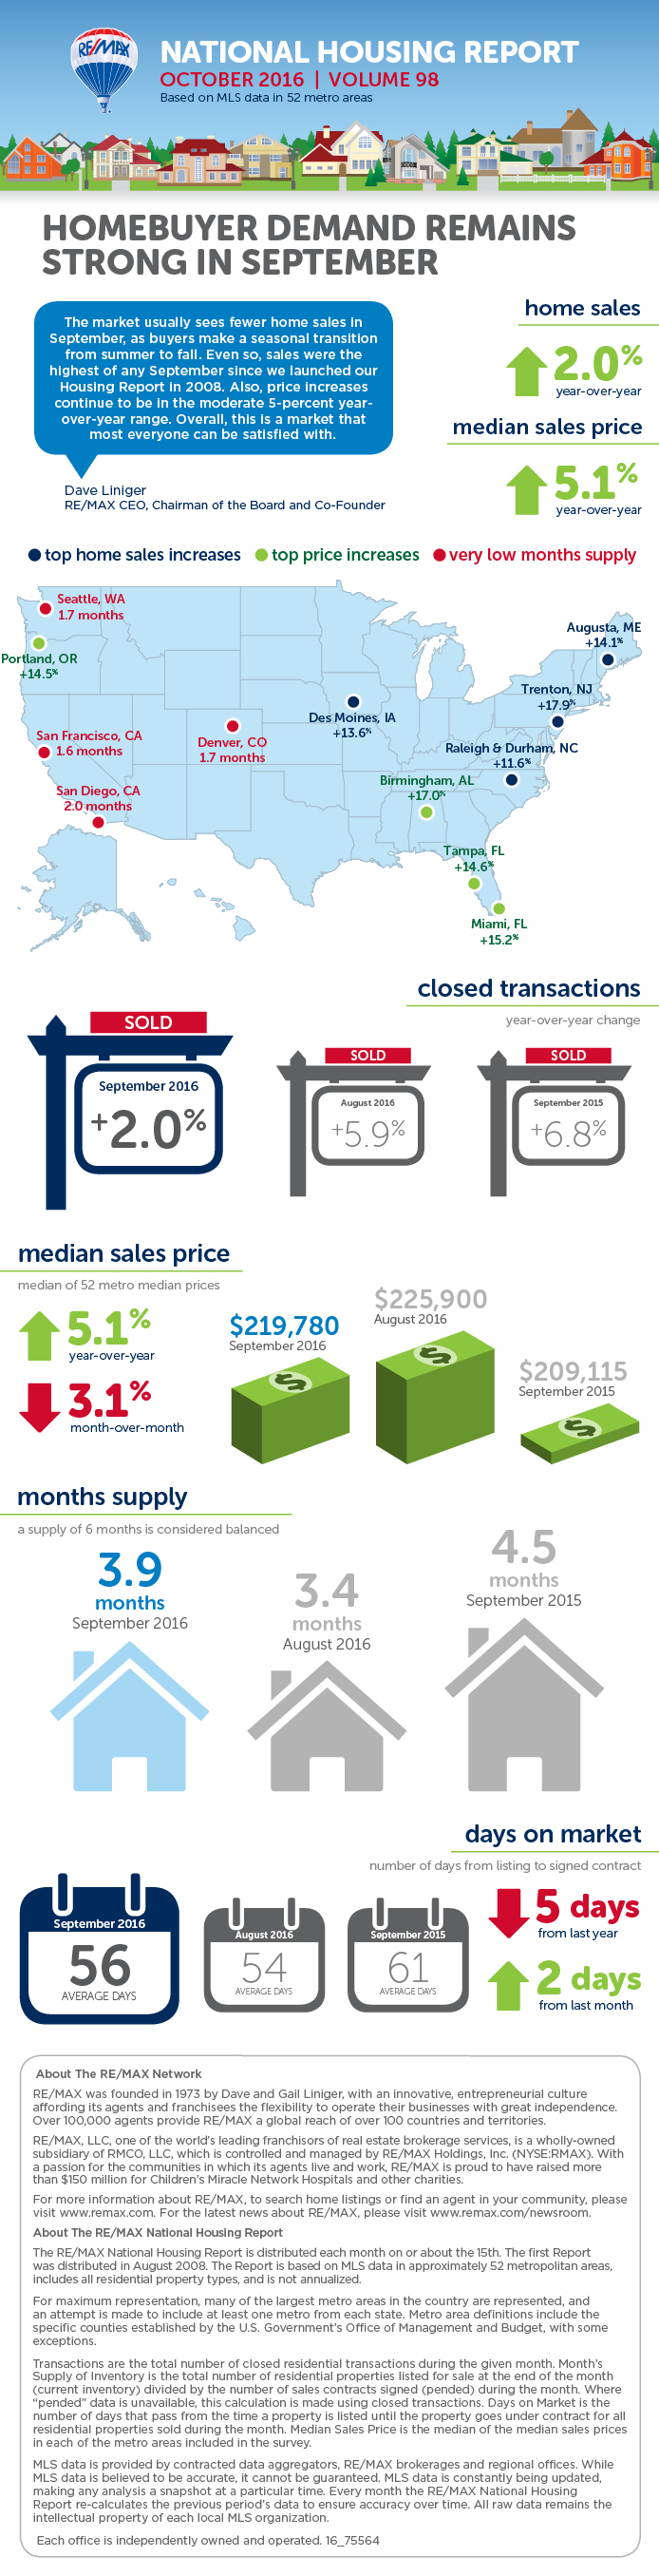
DENVER (Oct. 17, 2016) – Though posting a typical seasonal dropoff from August, September’s U.S. home sales represented the most of any September in the 9-year history of the RE/MAX National Housing Report. Home sales dropped 11.7% from August to September – nearly the same as the 11.0% average decline over the previous eight years of the Report. But sales increased 2.0% over September 2015 which had previously been the best September.
 
The September Median Sales Price of $219,780 was 5.1% above a year ago. And in a rare occurrence, not a single metro posted a year-over-year price drop. The largest price gains were reported in Birmingham, AL (17.0%) and Miami (15.2%). The average Months Supply of Inventory rose from 3.4 in August to 3.9, the highest since February. But it is still far below the 6 months supply considered to be a market balanced equally between buyers and sellers. Eight markets, predominantly in the Northeast, have a 6 or more month supply. Meanwhile, 19 have 3 months or less, with the majority being in the West. 
 
The market usually sees fewer home sales in September, as buyers make a seasonal transition from summer to fall,”said Dave Liniger, RE/MAX CEO, Chairman of the Board and Co-Founder. “Even so, sales were the highest of any September since we launched our Housing Report in 2008. Also, price increases continue to be in the moderate 5-percent year-over-year range. Overall, this is a market that most everyone can be satisfied with.”
 
Closed Transactions 
In the 52 metro areas surveyed in September, the average number of home sales increased by 2.0% compared to one year ago, which makes the eighth month this year with a year-over-year increase in sales. This marks the strongest September of sales since the Report’s inception in 2008. However, September showed a 11.7% decrease from August, but this is in line with decreases in previous years. This month, 34 markets experienced an increase in sales year-over-year with 6 markets seeing double-digit increases. Those markets include Trenton, NJ, +17.9%, Augusta, ME, +14.1%, Des Moines, IA +13.6%, Raleigh & Durham, NC, +11.6%, Boise, ID +11.3% and Seattle, WA 10.6%.
 
Median Sales Price – Median of 52 metro median prices
In September, the median of all 52 metro Median Sales Prices was $219,780, down slightly at -3.1% from August 2016 and up 5.1% from September 2015. The median price in Providence, RI was unchanged from last year, but every other metro area in the report saw year-over-year price increases, with 12 rising by double-digit percentages. The largest double-digit increases were seen in Birmingham, AL +17.0%, Miami, FL +15.2%, Tampa, FL +14.6%, Portland, OR +14.5%, Denver, CO +13.1% and Boise, ID +12.6%.

Days on Market – Average of 52 metro areas
The average Days on Market for homes sold in September was 56, up two days from the average in August 2016, but down five days from September 2015. September becomes the 42nd consecutive month with a Days on Market average of 80 or less. The three metro areas with the lowest Days on Market are Omaha, Denver and San Francisco at 25, 27 and 28 respectively. The highest Days on Market averages continue to be in Augusta, ME at 128, and Des Moines, IA at 98. Days on Market is the number of days between when a home is first listed in an MLS and a sales contract is signed. 
 
Months Supply of Inventory – Average of 52 metro areas
The number of homes for sale in September was down 2.6% from August, and down 15.1% from September 2015. Based on the rate of home sales in September, the Months Supply of Inventory was 3.9, compared to both last month and last year at 3.4 and 4.5 respectively. A 6.0-month supply indicates a market balanced equally between buyers and sellers. This month, only six metro areas reported a Months Supply of Inventory at 6.0 or above. The markets with the lowest Months Supply of Inventory are San Francisco, CA 1.6, Seattle, WA 1.7 and Denver at 1.7.


Selling your house with the help of a home stager. Will it help?

by Elite Asset Management Team

If you’re selling your home then home staging may be one of the avenues you can take to help you sell your home quicker.

Julia Rolland of Tabula Rasa Home Staging, who has been working in the Albuquerque market for many years, says that “ buying a home is an emotional experience and the way your property is staged will determine whether it’s love at first sight”.  It is important to note that buyers will name your property as a way to sort all the houses they have visited. Staging will improve the chance the name will be “The One”.

Homebuyers are all different. They have their own preferences and tastes so making the home more neutral or matching what’s inside the home to the style of the home may help homebuyers see the home in a better light. Here’s what you need to know about home staging.


The Home Stager

Home stagers offer a range of services starting with a basic consultation to a fully staged home. Stagers check the home with the eye of a buyer and thinks of ways to improve the look of a space.

After the walkthrough of the homes, she gives the homeowners her detailed notes and sometimes this would be enough for the homeowners to get their homes organized. If the homeowners need more help in staging, she can help decorate the home for a price. She can also provide furniture and other accessories, like other home stagers, which can improve the overall look of the home.

Remember, homebuyers imagine themselves living in your home. They imagine their own stuff in your home and think of how they’ll be living in it. Having too much clutter may turn them off.


Do You Need A Home Stager?

It all depends on you and the market. Home stagers can help, with some of them claiming that people they help sell their homes faster and for more money. You can do the necessary adjustments yourself. If you have an eye for it, then go for it. If you have no time then it may be a good option.

The market also plays a role in it. In a bad market, your home can stand out. In a good market, your home will be compared to other homes around you.

Homebuyers can make a decision in the first 30 seconds of entering your home so presentation is key. Homebuyers these days search for homes online and make their decision based on the photos of your home. Having great photos of your home can greatly increase the chance of getting homebuyers interested.

You can search online for free advice, for photos of home designs and other sources of information about home staging. They will help you if you decide to stage your home yourself. If you’ve been having a hard time selling because of the way your home looks, then you may want to consider hiring a home stager. 


SEPTEMBER 2016 RE/MAX NATIONAL MARKET UPDATE

by Elite Asset Management Team

Home Sales Cool, Price Increases Moderate


DENVER (August 19, 2016) – Unlike the month’s temperatures, July home sales cooled off from June’s highest year-to-date level. In the RE/MAX National Housing Report analysis of 53 U.S. cities, July sales fell in 49 markets by 8.8% from July 2015 and by 13.1% from June. Over the last seven years, the average drop in sales from June to July has been 8.2%. The Median Sales Price dropped slightly from June to $225,000, which is still 4.7% higher than one year ago. At the same time, inventory continued to tighten by dropping 3.0% lower than June and 16.6% lower than a year ago, resulting in a Months Supply of just 3.5. Five metro areas reported an inventory supply of less than two months. Meanwhile, the average Days on Market dropped to 53 which is just one day less than the average in June and four days below last year.


“After a June jump in home sales, it's quite common to see July sales make a correction. This is a summertime pattern that we often see on a national level. Of course, one month doesn't make a trend and we still have a couple more months ahead in the traditional home-buying season. At the same time, it's important to note that, on a year-over-year basis, prices are rising at a moderate rate that's very much in line with historical averages," said Dave Liniger, RE/MAX CEO, Chairman of the Board and Co-Founder.


“One of the most important things for consumers to realize is just how regionalized housing truly is. While those on the West coast are being surprised by their high appraisals, homeowners in the Northeast and Midwest are more likely to be shocked by their low values. If homeowners keep an eye on local home sales, they can be better aware of their current home value and not be shocked when they go to sell or refinance,” added Bob Walters, Quicken Loans, Chief Economist.


Closed Transactions – Year-over-year change

In the 53 metro areas surveyed in July, the average number of home sales was 8.8% lower than one year ago, and was 13.1% lower than the previous month. It’s not unusual to see a midsummer slowdown in sales. Over the last seven years, the average drop in sales from June to July has been 8.2%. Despite the trend, four metro areas surveyed reported sales higher than one year ago, including Providence, RI +3.7%, Boise, ID +2.1%, Raleigh-Durham, NC +1.4%, and Albuquerque, NM +0.2%.


Median Sales Price – Median of 53 metro median prices

In July, the median of all 53 metro Median Sales Prices was $225,000, down 1.3% from June 2016, but up 4.7% from the Median Sales Price in July 2015. July is the 54th consecutive month without a drop in price from the previous year. The 4.7% increase in prices continues this year’s trend of moderating price increases. Among the 53 metro areas surveyed in July, only three had a year-over-year drop in Median Sales Price. Two metro areas reported numbers that were unchanged and the remaining 48 metros reported higher prices than one year ago, with ten rising by double-digit percentages, including Honolulu, HI +14.8%, Orlando, FL +14.4%,  Nashville, TN +14.0%, Tampa, FL +13.0%, Denver, CO +12.2% and Portland, OR +11.3%.


Days on Market – Average of 53 metro areas

The average Days on Market for all homes sold in July was 53, down one day from the average of 54 in June 2016, and down four days from the average of 57 in July 2015. July 2016 was the 40th consecutive month with a Days on Market average of 80 or less. In the four markets with the lowest inventory supply, Denver, Seattle, San Francisco and Omaha, Days on Market was 21, 23, 24 and 24 respectively. The highest Days on Market averages were seen in Augusta, ME at 130, down from 142 in June, and Des Moines, IA at 90, down from 102 in June. Days on Market is the number of days between when a home is first listed in an MLS and a sales contract is signed.


Month’s Supply of Inventory – Average of 53 metro areas

The number of homes for sale in July was 3.0% lower than in June, and 16.6% lower than in July 2015. Based on the rate of home sales in July, the Months Supply of Inventory was 3.5, which is close to last month and last year, 3.2 and 3.9 respectively. A six-month supply indicates a market balanced equally between buyers and sellers. The number of metros with a Months Supply of Inventory below 2.0 may also be stabilizing at five, down from eight in June. The five metros with less than a two-month supply include Denver, CO 1.4, Seattle, WA 1.4, San Francisco, CA 1.5, Portland, OR 1.8 and Omaha, NE 1.9.


Feel free to contact me and I can help break down exactly what these numbers mean for our local market and for your neighborhood.

And lastly, If you or anyone you know is thinking of buying or selling a home - please call or email me. I'm here to help!

Peter Veres

Associate Broker, CRS,ABR,CLHMS,SRES

Elite Asset Management Team - RE/MAX Elite

www.PeteVeres.com

Cell: 505-362-2005

 Office: 505-798-1000


Displaying blog entries 1-3 of 3

Syndication

Categories

Archives

Contact Information

Photo of Elite Asset Management  Real Estate
Elite Asset Management
RE/MAX SELECT
8300 Carmel Ave. NE Ste. 203
Albuquerque NM 87122
(505)362-2005

zillow reviews