Real Estate Information Archive

Blog

Displaying blog entries 61-70 of 70

DECEMBER 2016 RE/MAX NATIONAL MARKET UPDATE

by Elite Asset Management Team
November Home Sales Defy Seasonal Trend
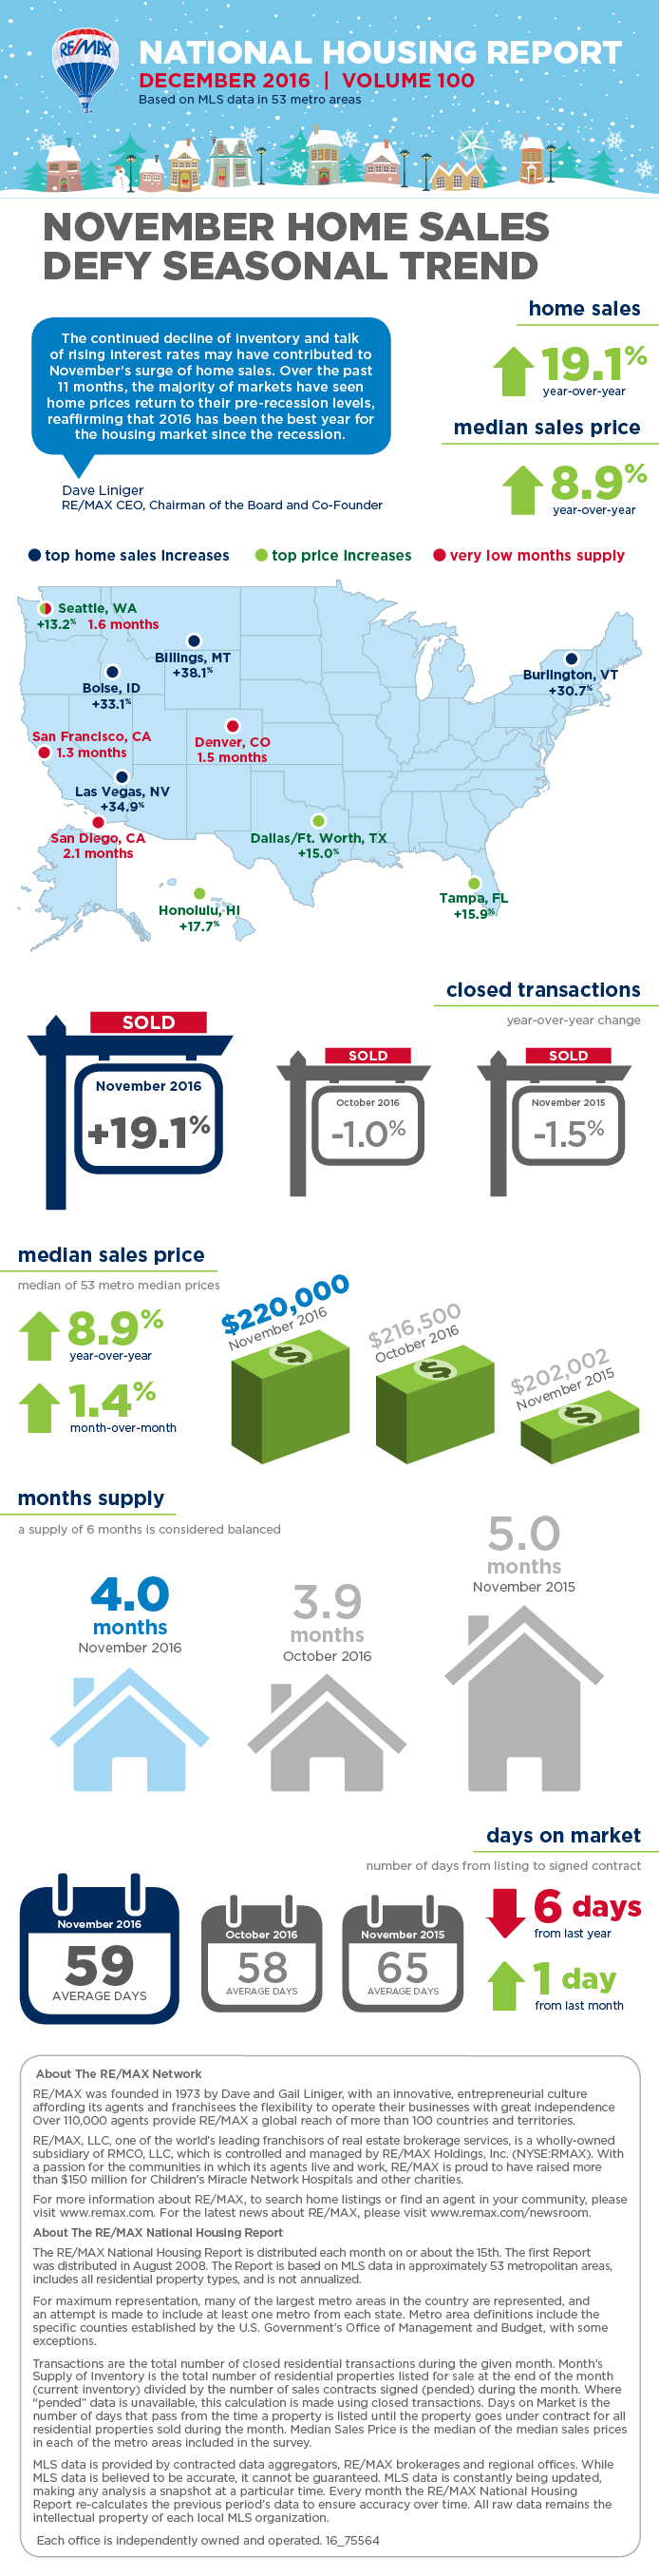
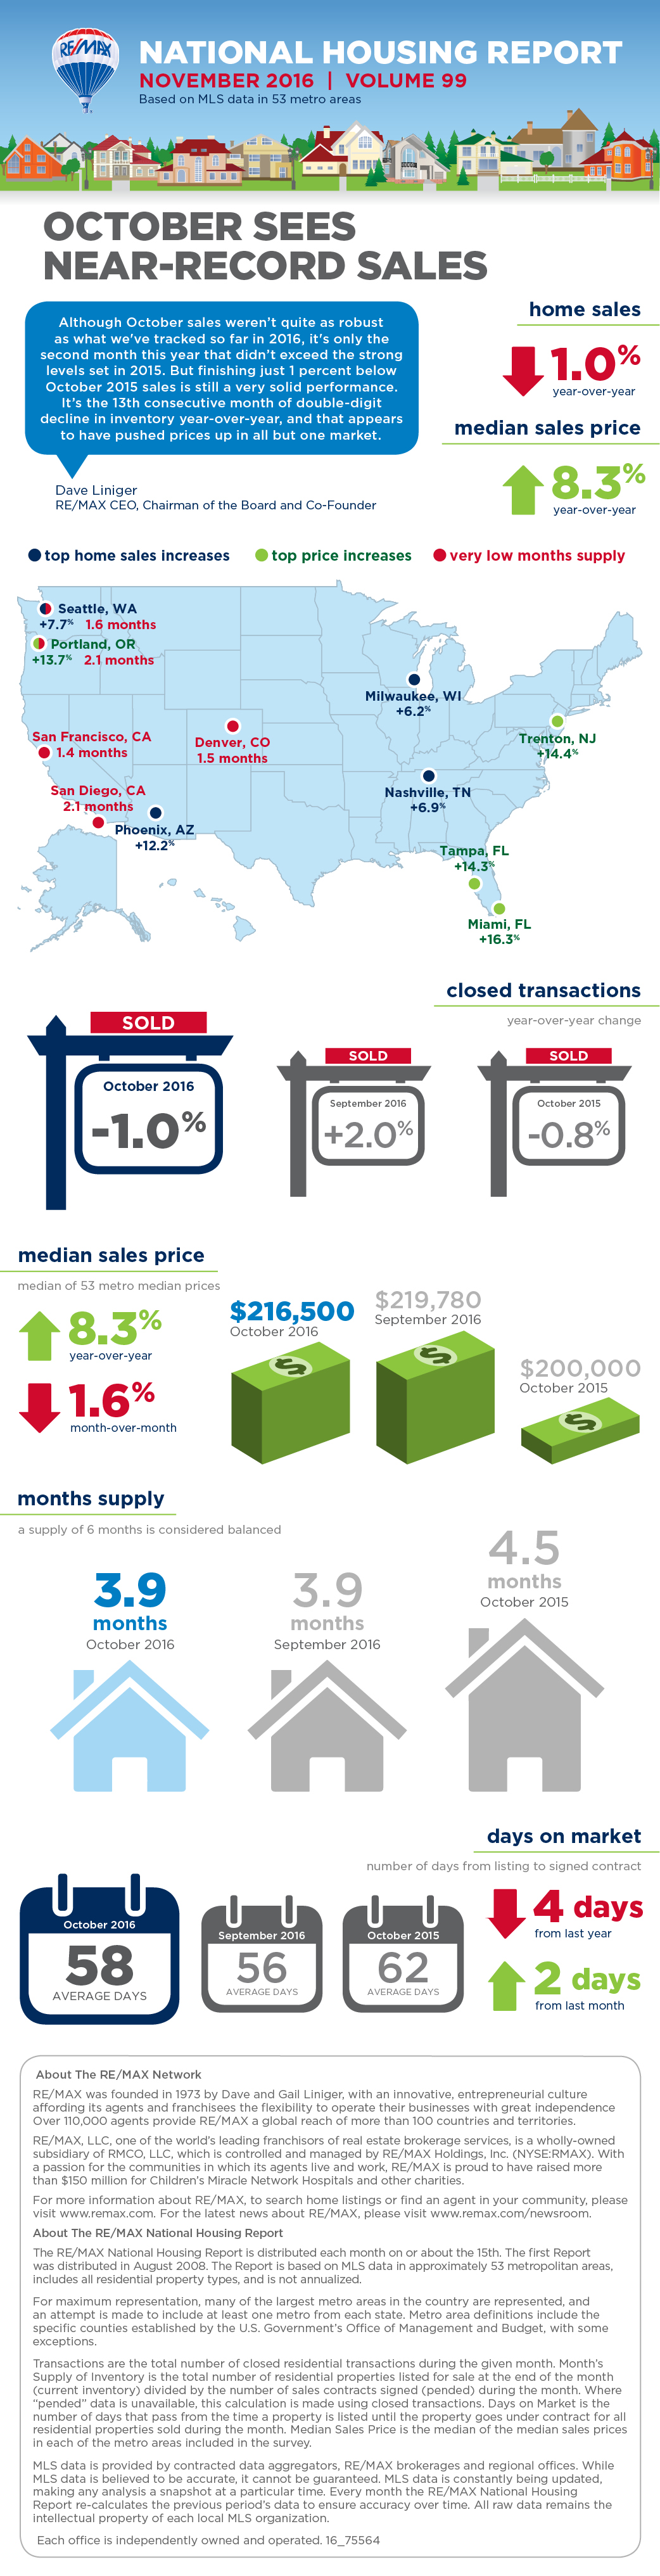
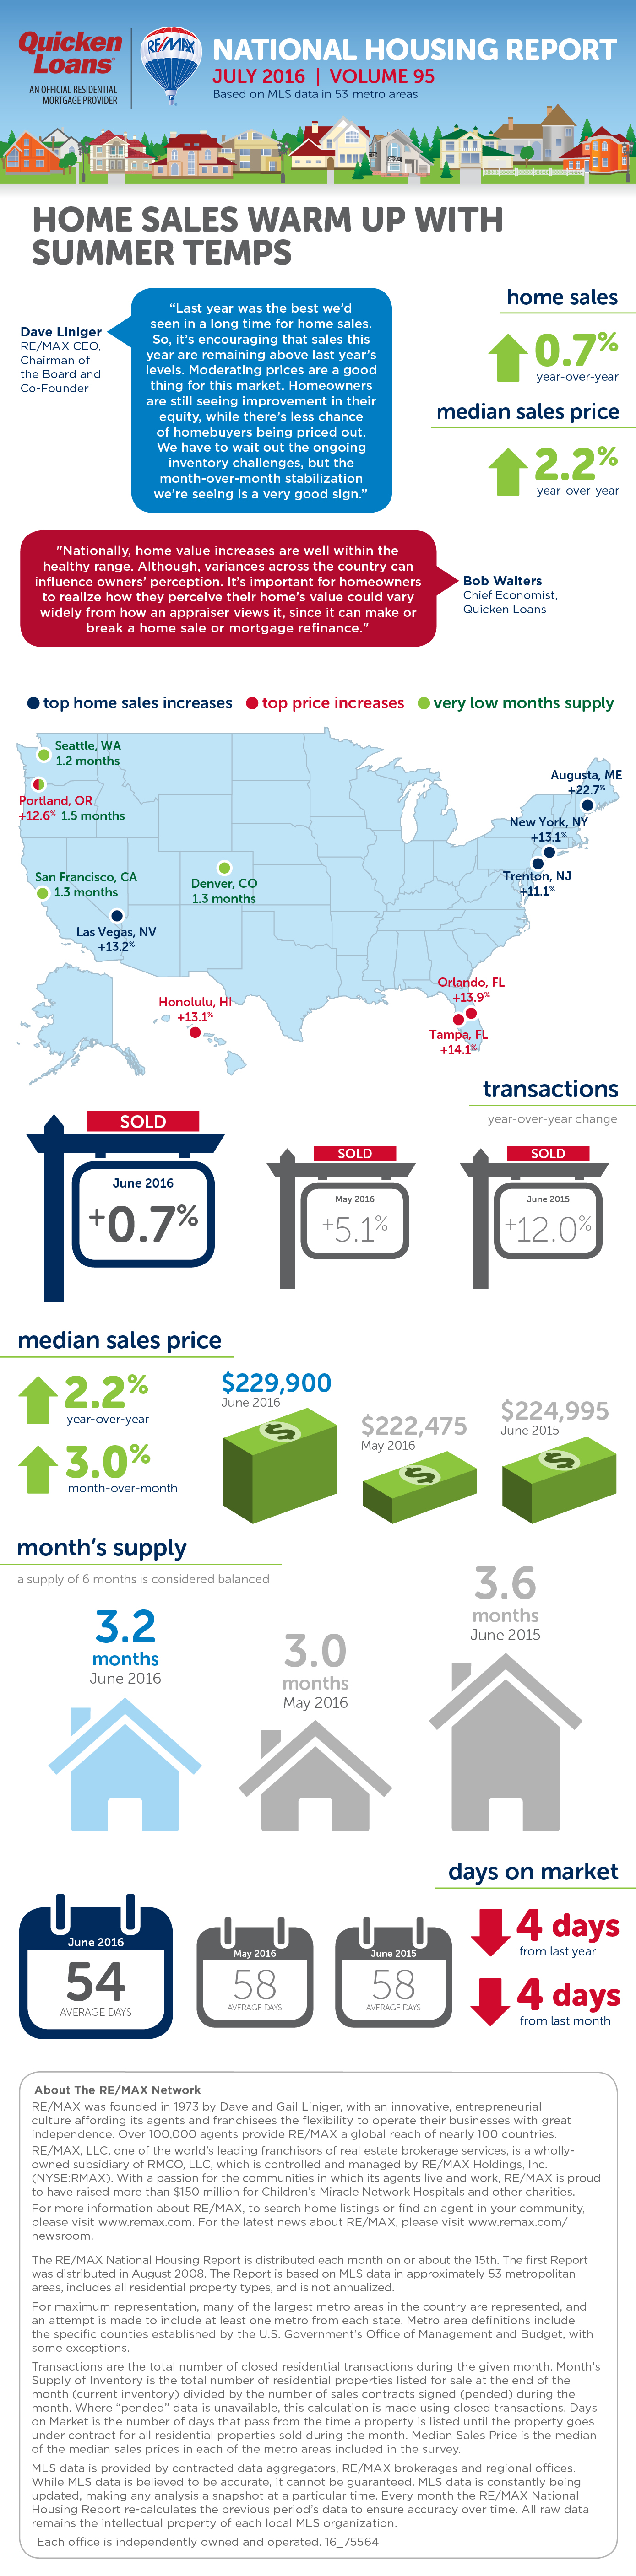
DENVER (Dec. 16, 2016) – Despite the typical winter slowdown, November home sales finished 19.1% above a year ago and prices increased 1.4% over October. All but one of the 53 markets in the RE/MAX National Housing Report posted an increased number of sales over November 2015, with nearly half of the markets at least 20% higher. In all, last month saw more homes sold than any other November in the eight-year history of the report.
 
With one month to go, 2016 is on pace to exceed what was a strong 2015. Year-over-year, 2016 has posted price increases or stayed flat in all 11 months to date, and sales increases in nine months. November posted the largest percentage year-over-year sales increase thus far in 2016.
 
Last month, the Median Sales Price among the 53 markets edged above October at $220,000 and finished 8.9% higher than November 2015. As in the first 10 months of 2016, inventory continued to drop year-over-year, with a decline of 17.0%.
 
November’s Months Supply of Inventory was 4.0, compared to the 5.0 months supply reported in November 2015. Days On Market averaged 59, compared to 58 in October and 65 a year ago. 

The continued decline of inventory and talk of rising interest rates may have contributed to November’s surge of home sales,” said Dave Liniger, RE/MAX CEO, Chairman of the Board and Co-Founder. Over the past 11 months, the majority of markets have seen home prices return to their pre-recession levels, reaffirming that 2016 has been the best year for the housing market since the recession.”
 
Closed Transactions 
Of the 53 metro areas surveyed in November, the average number of home sales increased 19.1% compared to one year ago, which marks the second highest increase in the eight-year history of the report. This month, only one of the 53 metro areas surveyed experienced a decrease in sales year-over-year (Miami, FL at -11.4%) while the remaining 52 saw increases.  The markets with the largest increase in sales include Billings, MT +38.1%, Las Vegas, NV +34.9%, Boise, ID +33.1%, Burlington, VT +30.7%, Honolulu, HI +30.3% and Phoenix, AZ, +29.1%.
 
Median Sales Price – Median of 53 metro median prices
In November, the median of all 53 metro Median Sales Prices was $220,000, up 1.4% from last month and up 8.9% from November 2015. Of the 53 metro areas surveyed, all but two (Burlington, VT and Des Moines, IA) saw year-over-year increases with respect to Median Sales Price, 15 rising by double-digit percentages. The largest double-digit increases were seen in Honolulu, HI +17.7%, Tampa, FL +15.9%, Dallas/Ft. Worth, TX +15.0%, Seattle, WA +13.2% and Birmingham, AL +13.1%.

Days on Market – Average of 53 metro areas
The average Days on Market for homes sold in November was 59, up one day from the average in October 2016, but down six days from this time last year. The two metro areas with the lowest Days on Market are San Francisco and Denver at 32 and 33 respectively. The highest Days on Market averages continue to be in Augusta, ME at 148, and Burlington, VT at 97. Days on Market is the number of days between when a home is first listed in an MLS and a sales contract is signed. 
 
Months Supply of Inventory – Average of 53 metro areas
The number of homes for sale in November was down 9.3% from October, and down 17.0% from November 2015. Based on the rate of home sales in November, the Months Supply of Inventory was 4.0, compared to last month at 3.9 and last year at 5.0. A 6.0-month supply indicates a market balanced equally between buyers and sellers. In November, 49 of the 53 metro areas surveyed reported a months supply of less than 6.0, which is typically considered a seller’s market. The remaining four reported a months supply above 6.0 which is typically considered a buyers market. The markets with the lowest Months Supply of Inventory continue to be San Francisco, CA at 1.3, Denver, CO at 1.5 and Seattle, WA 1.6, with Denver and Seattle seeing the same Months Supply of Inventory as last month.


NOVEMBER 2016 RE/MAX NATIONAL MARKET UPDATE

by Elite Asset Management Team

November 2016 RE/MAX National Housing Report & Local Market Snapshot

October Sees Near-Record Sales

November 17, 2016


DENVER (Nov. 17, 2016) – Last month saw the second-most sales – and the smallest inventory – of any October in the 9-year history of the RE/MAX National Housing Report. Add to that combination the highest year-over-year price increase of 2016 thus far: 8.3%.
 
Although posting near-record sales, this October finished 1% below October 2015 sales, which posted the highest of any October dating back to 2008. Sales declined year-over-year in 28 of the 53 markets surveyed, including many New England markets.

The number of homes for sale was the lowest of any month since May, and also the lowest of any October dating back to 2008. Inventory declined in 48 of the 53 markets surveyed. The Months Supply of Inventory was 3.9.

Reflecting strong sales and shrinking inventory, last month’s Median Sales Price increased by 8.3% to $216,500. Fueling the hike were double-digit increases in Florida markets (Miami, Tampa, Orlando) and markets with very low inventory (San Francisco and Denver). 

“Although October sales weren’t quite as robust as what we've tracked so far in 2016, it's only the second month this year that didn’t exceed the strong levels set in 2015. But finishing just 1 percent below October 2015 sales is still a very solid performance,” said Dave Liniger, RE/MAX CEO, Chairman of the Board and Co-Founder. “It’s the 13th consecutive month of double-digit decline in inventory year-over-year, and that appears to have pushed prices up in all but one market.”

Albuquerque, NM

As for the Great Albuquerque Area, Pete Veres wants to report that the median detached price rose 3.3 percent to $189,000, the number of new listings dropped 10.5 percent for single-family detached homes and 6.8 percent for condos, townhomes and other attached homes.  Overall inventory of detached homes for sale dropped 17.1 percent in October detached homes sold in an average of 54 days – which is 8.5 percent faster than in October 2015. These are all signs that our market has turned and is improving. 


National Closed Transactions
In the 53 metro areas surveyed in October, the average number of home sales decreased by 1.0% compared to one year ago, which marks the second month in 2016 with a decline. Despite a slight decrease in the number of transactions, this October is the second best in the history of the report. This month, less than half of the 53 metro areas surveyed experienced an increase in sales year-over-year with Providence, RI seeing home sales that were unchanged and only one market seeing a double-digit increase. The markets with the largest increase in sales include Phoenix, AZ +12.2%, Seattle, WA +7.7%, Nashville, TN +6.9%, Milwaukee, WI +6.2%, Boise, ID +5.8% and Raleigh & Durham, NC, +4.9%.
 
Median Sales Price – Median of 53 metro median prices
In October, the median of all 53 metro Median Sales Prices was $216,500, down 1.6% from last month and up 8.3% from October 2015. Of the 53 metro areas surveyed, all but one (Billings, MT) saw year-over-year increases with respect to Median Sales Price, with 14 rising by double-digit percentages. The largest double-digit increases were seen in Miami, FL +16.3%, Trenton, NJ +14.4%, Tampa, FL +14.3%, Portland, OR +13.7% and Orlando, FL +13.7%.

Days on Market – Average of 53 metro areas
The average Days on Market for homes sold in October was 58, up two days from the average in September 2016, but down four days from October 2015. October becomes the 43rd consecutive month with a Days on Market average of 80 or less. Similar to the past two months, the two metro areas with the lowest Days on Market are Omaha and Denver at 28 and 29 respectively. The highest Days on Market averages continue to be in Augusta, ME at 143, and Burlington, VT at 99. Days on Market is the number of days between when a home is first listed in an MLS and a sales contract is signed. 
 
Months Supply of Inventory – Average of 53 metro areas
The number of homes for sale in October was down 6.7% from September, and down 15.9% from October 2015. Based on the rate of home sales in October, the Months Supply of Inventory was 3.9, compared to last month at 3.9 and last year at 4.5. A 6.0-month supply indicates a market balanced equally between buyers and sellers. This month, only five metro areas reported a balanced market at 6.0 or above. The markets with the lowest Months Supply of Inventory are San Francisco, CA 1.4, Denver, CO at 1.5 and Seattle, WA 1.6. 


As for the Great Albuquerque Area, Pete Veres wants to report that the median detached price rose 3.3 percent to $189,000, the number of new listings dropped 10.5 percent for single-family detached homes and 6.8 percent for condos, townhomes and other attached homes.  Overall inventory of detached homes for sale dropped 17.1 percent in October detached homes sold in an average of 54 days – which is 8.5 percent faster than in October 2015. These are all signs that our market has turned and is improving.

OCTOBER 2016 RE/MAX NATIONAL MARKET UPDATE

by Elite Asset Management Team

Homebuyer Demand Remains Strong in September


DENVER (Oct. 17, 2016) – Though posting a typical seasonal dropoff from August, September’s U.S. home sales represented the most of any September in the 9-year history of the RE/MAX National Housing Report. Home sales dropped 11.7% from August to September – nearly the same as the 11.0% average decline over the previous eight years of the Report. But sales increased 2.0% over September 2015 which had previously been the best September.
 
The September Median Sales Price of $219,780 was 5.1% above a year ago. And in a rare occurrence, not a single metro posted a year-over-year price drop. The largest price gains were reported in Birmingham, AL (17.0%) and Miami (15.2%). The average Months Supply of Inventory rose from 3.4 in August to 3.9, the highest since February. But it is still far below the 6 months supply considered to be a market balanced equally between buyers and sellers. Eight markets, predominantly in the Northeast, have a 6 or more month supply. Meanwhile, 19 have 3 months or less, with the majority being in the West. 
 
The market usually sees fewer home sales in September, as buyers make a seasonal transition from summer to fall,”said Dave Liniger, RE/MAX CEO, Chairman of the Board and Co-Founder. “Even so, sales were the highest of any September since we launched our Housing Report in 2008. Also, price increases continue to be in the moderate 5-percent year-over-year range. Overall, this is a market that most everyone can be satisfied with.”
 
Closed Transactions 
In the 52 metro areas surveyed in September, the average number of home sales increased by 2.0% compared to one year ago, which makes the eighth month this year with a year-over-year increase in sales. This marks the strongest September of sales since the Report’s inception in 2008. However, September showed a 11.7% decrease from August, but this is in line with decreases in previous years. This month, 34 markets experienced an increase in sales year-over-year with 6 markets seeing double-digit increases. Those markets include Trenton, NJ, +17.9%, Augusta, ME, +14.1%, Des Moines, IA +13.6%, Raleigh & Durham, NC, +11.6%, Boise, ID +11.3% and Seattle, WA 10.6%.
 
Median Sales Price – Median of 52 metro median prices
In September, the median of all 52 metro Median Sales Prices was $219,780, down slightly at -3.1% from August 2016 and up 5.1% from September 2015. The median price in Providence, RI was unchanged from last year, but every other metro area in the report saw year-over-year price increases, with 12 rising by double-digit percentages. The largest double-digit increases were seen in Birmingham, AL +17.0%, Miami, FL +15.2%, Tampa, FL +14.6%, Portland, OR +14.5%, Denver, CO +13.1% and Boise, ID +12.6%.

Days on Market – Average of 52 metro areas
The average Days on Market for homes sold in September was 56, up two days from the average in August 2016, but down five days from September 2015. September becomes the 42nd consecutive month with a Days on Market average of 80 or less. The three metro areas with the lowest Days on Market are Omaha, Denver and San Francisco at 25, 27 and 28 respectively. The highest Days on Market averages continue to be in Augusta, ME at 128, and Des Moines, IA at 98. Days on Market is the number of days between when a home is first listed in an MLS and a sales contract is signed. 
 
Months Supply of Inventory – Average of 52 metro areas
The number of homes for sale in September was down 2.6% from August, and down 15.1% from September 2015. Based on the rate of home sales in September, the Months Supply of Inventory was 3.9, compared to both last month and last year at 3.4 and 4.5 respectively. A 6.0-month supply indicates a market balanced equally between buyers and sellers. This month, only six metro areas reported a Months Supply of Inventory at 6.0 or above. The markets with the lowest Months Supply of Inventory are San Francisco, CA 1.6, Seattle, WA 1.7 and Denver at 1.7.


SEPTEMBER 2016 RE/MAX NATIONAL MARKET UPDATE

by Elite Asset Management Team

Home Sales Cool, Price Increases Moderate


DENVER (August 19, 2016) – Unlike the month’s temperatures, July home sales cooled off from June’s highest year-to-date level. In the RE/MAX National Housing Report analysis of 53 U.S. cities, July sales fell in 49 markets by 8.8% from July 2015 and by 13.1% from June. Over the last seven years, the average drop in sales from June to July has been 8.2%. The Median Sales Price dropped slightly from June to $225,000, which is still 4.7% higher than one year ago. At the same time, inventory continued to tighten by dropping 3.0% lower than June and 16.6% lower than a year ago, resulting in a Months Supply of just 3.5. Five metro areas reported an inventory supply of less than two months. Meanwhile, the average Days on Market dropped to 53 which is just one day less than the average in June and four days below last year.


“After a June jump in home sales, it's quite common to see July sales make a correction. This is a summertime pattern that we often see on a national level. Of course, one month doesn't make a trend and we still have a couple more months ahead in the traditional home-buying season. At the same time, it's important to note that, on a year-over-year basis, prices are rising at a moderate rate that's very much in line with historical averages," said Dave Liniger, RE/MAX CEO, Chairman of the Board and Co-Founder.


“One of the most important things for consumers to realize is just how regionalized housing truly is. While those on the West coast are being surprised by their high appraisals, homeowners in the Northeast and Midwest are more likely to be shocked by their low values. If homeowners keep an eye on local home sales, they can be better aware of their current home value and not be shocked when they go to sell or refinance,” added Bob Walters, Quicken Loans, Chief Economist.


Closed Transactions – Year-over-year change

In the 53 metro areas surveyed in July, the average number of home sales was 8.8% lower than one year ago, and was 13.1% lower than the previous month. It’s not unusual to see a midsummer slowdown in sales. Over the last seven years, the average drop in sales from June to July has been 8.2%. Despite the trend, four metro areas surveyed reported sales higher than one year ago, including Providence, RI +3.7%, Boise, ID +2.1%, Raleigh-Durham, NC +1.4%, and Albuquerque, NM +0.2%.


Median Sales Price – Median of 53 metro median prices

In July, the median of all 53 metro Median Sales Prices was $225,000, down 1.3% from June 2016, but up 4.7% from the Median Sales Price in July 2015. July is the 54th consecutive month without a drop in price from the previous year. The 4.7% increase in prices continues this year’s trend of moderating price increases. Among the 53 metro areas surveyed in July, only three had a year-over-year drop in Median Sales Price. Two metro areas reported numbers that were unchanged and the remaining 48 metros reported higher prices than one year ago, with ten rising by double-digit percentages, including Honolulu, HI +14.8%, Orlando, FL +14.4%,  Nashville, TN +14.0%, Tampa, FL +13.0%, Denver, CO +12.2% and Portland, OR +11.3%.


Days on Market – Average of 53 metro areas

The average Days on Market for all homes sold in July was 53, down one day from the average of 54 in June 2016, and down four days from the average of 57 in July 2015. July 2016 was the 40th consecutive month with a Days on Market average of 80 or less. In the four markets with the lowest inventory supply, Denver, Seattle, San Francisco and Omaha, Days on Market was 21, 23, 24 and 24 respectively. The highest Days on Market averages were seen in Augusta, ME at 130, down from 142 in June, and Des Moines, IA at 90, down from 102 in June. Days on Market is the number of days between when a home is first listed in an MLS and a sales contract is signed.


Month’s Supply of Inventory – Average of 53 metro areas

The number of homes for sale in July was 3.0% lower than in June, and 16.6% lower than in July 2015. Based on the rate of home sales in July, the Months Supply of Inventory was 3.5, which is close to last month and last year, 3.2 and 3.9 respectively. A six-month supply indicates a market balanced equally between buyers and sellers. The number of metros with a Months Supply of Inventory below 2.0 may also be stabilizing at five, down from eight in June. The five metros with less than a two-month supply include Denver, CO 1.4, Seattle, WA 1.4, San Francisco, CA 1.5, Portland, OR 1.8 and Omaha, NE 1.9.


Feel free to contact me and I can help break down exactly what these numbers mean for our local market and for your neighborhood.

And lastly, If you or anyone you know is thinking of buying or selling a home - please call or email me. I'm here to help!

Peter Veres

Associate Broker, CRS,ABR,CLHMS,SRES

Elite Asset Management Team - RE/MAX Elite

www.PeteVeres.com

Cell: 505-362-2005

 Office: 505-798-1000


AUGUST 2016 RE/MAX NATIONAL MARKET UPDATE

by Elite Asset Management Team

HOME SALES COOL, PRICE INCREASE MODERATE


DENVER (August 19, 2016)  Unlike the month’s temperatures, July home sales cooled off from June’s highest year-to-date level. In the RE/MAX National Housing Report analysis of 53 U.S. cities, July sales fell in 49 markets by 8.8% from July 2015 and by 13.1% from June. Over the last seven years, the average drop in sales from June to July has been 8.2%. The Median Sales Price dropped slightly from June to $225,000, which is still 4.7% higher than one year ago. At the same time, inventory continued to tighten by dropping 3.0% lower than June and 16.6% lower than a year ago, resulting in a Months Supply of just 3.5. Five metro areas reported an inventory supply of less than two months. Meanwhile, the average Days on Market dropped to 53 which is just one day less than the average in June and four days below last year. For this month’s housing report infographic, visit.  
 
“After a June jump in home sales, it's quite common to see July sales make a correction. This is a summertime pattern that we often see on a national level. Of course, one month doesn't make a trend and we still have a couple more months ahead in the traditional home-buying season. At the same time, it's important to note that, on a year-over-year basis, prices are rising at a moderate rate that's very much in line with historical averages," said Dave Liniger, RE/MAX CEO, Chairman of the Board and Co-Founder. 
 
“One of the most important things for consumers to realize is just how regionalized housing truly is. While those on the West coast are being surprised by their high appraisals, homeowners in the Northeast and Midwest are more likely to be shocked by their low values. If homeowners keep an eye on local home sales, they can be better aware of their current home value and not be shocked when they go to sell or refinance,” added Bob Walters, Quicken Loans, Chief Economist. 
 
Closed Transactions – Year-over-year change
In the 53 metro areas surveyed in July, the average number of home sales was 8.8% lower than one year ago, and was 13.1% lower than the previous month. It’s not unusual to see a midsummer slowdown in sales. Over the last seven years, the average drop in sales from June to July has been 8.2%. Despite the trend, four metro areas surveyed reported sales higher than one year ago, including Providence, RI +3.7%, Boise, ID +2.1%, Raleigh-Durham, NC +1.4%, and Albuquerque, NM +0.2%.
 
Median Sales Price – Median of 53 metro median prices
In July, the median of all 53 metro Median Sales Prices was $225,000, down 1.3% from June 2016, but up 4.7% from the Median Sales Price in July 2015. July is the 54th consecutive month without a drop in price from the previous year. The 4.7% increase in prices continues this year’s trend of moderating price increases. Among the 53 metro areas surveyed in July, only three had a year-over-year drop in Median Sales Price. Two metro areas reported numbers that were unchanged and the remaining 48 metros reported higher prices than one year ago, with ten rising by double-digit percentages, including Honolulu, HI +14.8%, Orlando, FL +14.4%,  Nashville, TN +14.0%, Tampa, FL +13.0%, Denver, CO +12.2% and Portland, OR +11.3%.

Days on Market – Average of 53 metro areas
The average Days on Market for all homes sold in July was 53, down one day from the average of 54 in June 2016, and down four days from the average of 57 in July 2015. July 2016 was the 40th consecutive month with a Days on Market average of 80 or less. In the four markets with the lowest inventory supply, Denver, Seattle, San Francisco and Omaha, Days on Market was 21, 23, 24 and 24 respectively. The highest Days on Market averages were seen in Augusta, ME at 130, down from 142 in June, and Des Moines, IA at 90, down from 102 in June. Days on Market is the number of days between when a home is first listed in an MLS and a sales contract is signed. 
 
Month’s Supply of Inventory – Average of 53 metro areas
The number of homes for sale in July was 3.0% lower than in June, and 16.6% lower than in July 2015. Based on the rate of home sales in July, the Months Supply of Inventory was 3.5, which is close to last month and last year, 3.2 and 3.9 respectively. A six-month supply indicates a market balanced equally between buyers and sellers. The number of metros with a Months Supply of Inventory below 2.0 may also be stabilizing at five, down from eight in June. The five metros with less than a two-month supply include Denver, CO 1.4, Seattle, WA 1.4, San Francisco, CA 1.5, Portland, OR 1.8 and Omaha, NE 1.9.
 

Feel free to contact me and I can help break down exactly what these numbers mean for our local market and for your neighborhood.

And lastly, If you or anyone you know is thinking of buying or selling a home - please call or email me. I'm here to help!

Peter Veres

Associate Broker, CRS,ABR,CLHMS,SRES

Elite Asset Management Team - RE/MAX Elite

www.PeteVeres.com

Cell: 505-362-2005

 Office: 505-798-1000


DENVER (August 19, 2016)  Unlike the month’s temperatures, July home sales cooled off from June’s highest year-to-date level. In the RE/MAX National Housing Report analysis of 53 U.S. cities, July sales fell in 49 markets by 8.8% from July 2015 and by 13.1% from June. Over the last seven years, the average drop in sales from June to July has been 8.2%. The Median Sales Price dropped slightly from June to $225,000, which is still 4.7% higher than one year ago. At the same time, inventory continued to tighten by dropping 3.0% lower than June and 16.6% lower than a year ago, resulting in a Months Supply of just 3.5. Five metro areas reported an inventory supply of less than two months. Meanwhile, the average Days on Market dropped to 53 which is just one day less than the average in June and four days below last year. For this month’s housing report infographic, visit.  
 
“After a June jump in home sales, it's quite common to see July sales make a correction. This is a summertime pattern that we often see on a national level. Of course, one month doesn't make a trend and we still have a couple more months ahead in the traditional home-buying season. At the same time, it's important to note that, on a year-over-year basis, prices are rising at a moderate rate that's very much in line with historical averages," said Dave Liniger, RE/MAX CEO, Chairman of the Board and Co-Founder. 
 
“One of the most important things for consumers to realize is just how regionalized housing truly is. While those on the West coast are being surprised by their high appraisals, homeowners in the Northeast and Midwest are more likely to be shocked by their low values. If homeowners keep an eye on local home sales, they can be better aware of their current home value and not be shocked when they go to sell or refinance,” added Bob Walters, Quicken Loans, Chief Economist. 
 
Closed Transactions – Year-over-year change
In the 53 metro areas surveyed in July, the average number of home sales was 8.8% lower than one year ago, and was 13.1% lower than the previous month. It’s not unusual to see a midsummer slowdown in sales. Over the last seven years, the average drop in sales from June to July has been 8.2%. Despite the trend, four metro areas surveyed reported sales higher than one year ago, including Providence, RI +3.7%, Boise, ID +2.1%, Raleigh-Durham, NC +1.4%, and Albuquerque, NM +0.2%.
 
Median Sales Price – Median of 53 metro median prices
In July, the median of all 53 metro Median Sales Prices was $225,000, down 1.3% from June 2016, but up 4.7% from the Median Sales Price in July 2015. July is the 54th consecutive month without a drop in price from the previous year. The 4.7% increase in prices continues this year’s trend of moderating price increases. Among the 53 metro areas surveyed in July, only three had a year-over-year drop in Median Sales Price. Two metro areas reported numbers that were unchanged and the remaining 48 metros reported higher prices than one year ago, with ten rising by double-digit percentages, including Honolulu, HI +14.8%, Orlando, FL +14.4%,  Nashville, TN +14.0%, Tampa, FL +13.0%, Denver, CO +12.2% and Portland, OR +11.3%.

Days on Market – Average of 53 metro areas
The average Days on Market for all homes sold in July was 53, down one day from the average of 54 in June 2016, and down four days from the average of 57 in July 2015. July 2016 was the 40th consecutive month with a Days on Market average of 80 or less. In the four markets with the lowest inventory supply, Denver, Seattle, San Francisco and Omaha, Days on Market was 21, 23, 24 and 24 respectively. The highest Days on Market averages were seen in Augusta, ME at 130, down from 142 in June, and Des Moines, IA at 90, down from 102 in June. Days on Market is the number of days between when a home is first listed in an MLS and a sales contract is signed. 
 
Month’s Supply of Inventory – Average of 53 metro areas
The number of homes for sale in July was 3.0% lower than in June, and 16.6% lower than in July 2015. Based on the rate of home sales in July, the Months Supply of Inventory was 3.5, which is close to last month and last year, 3.2 and 3.9 respectively. A six-month supply indicates a market balanced equally between buyers and sellers. The number of metros with a Months Supply of Inventory below 2.0 may also be stabilizing at five, down from eight in June. The five metros with less than a two-month supply include Denver, CO 1.4, Seattle, WA 1.4, San Francisco, CA 1.5, Portland, OR 1.8 and Omaha, NE 1.9.
 

July 2016 RE/MAX National Market Update

by Elite Asset Management Team

Home Sales Warm Up With Summer Temps


DENVER (July 14, 2016 With the market now in the midst of the popular summer selling season, both home sales and prices are rising with the summer temperatures. Homebuyer demand in June kept sales levels above last year’s by 0.7%, with a strong increase of 9.4% over sales in May. The Median Sales Price in June was $229,900, which marks a 2.2% increase over prices seen in June 2015. As year-over-year price increases moderate, there’s a positive impact on home affordability. The number of homes for sale in June fell 15.6% from levels one year ago, making inventory supply a significant challenge, especially in West Coast metros. At the rate of home sales in June, the national Months Supply of Inventory was 3.2, a slight improvement from the 3.0 supply seen in May.
 
“Last year was the best we’d seen in a long time for home sales. So, it’s encouraging that sales this year are remaining above last year’s levels. Moderating prices are a good thing for this market. Homeowners are still seeing improvement in their equity, while there’s less chance of homebuyers being priced out. We have to wait out the ongoing inventory challenges, but the month-over-month stabilization we’re seeing is a very good sign,” said Dave Liniger, RE/MAX CEO, Chairman of the Board and Co-Founder. 
 
“Nationally, home value increases are well within the healthy range. Although, variances across the country can influence owners’ perception. It’s important for homeowners to realize how they perceive their home’s value could vary widely from how an appraiser views it, since it can make or break a home sale or mortgage refinance,” added Bob Walters, Quicken Loans, Chief Economist. 
 
Closed Transactions – Year-over-year change
In the 53 metro areas surveyed in June, the average number of home sales was 0.7% higher than one year ago, and was 9.4% higher than the previous month. Sales are slightly above the strong numbers seen last June and are also above the 6.7% average of month-to-month increases from May to June over the last eight years. Like previous months this year, June home sales continue to be strong in the Northeast. Across the nation, 31 of the 53 metro areas surveyed reported sales higher than one year ago, with six experiencing double-digit increases; Augusta, ME +22.7%, Las Vegas, NV +13.2%, New York, NY +13.1%, Trenton, NJ +11.1%, Cleveland, OH +11.1% and Hartford, CT +10.2%. 
 
Median Sales Price – Median of 53 metro median prices
In June, the median of all 53 metro Median Sales Prices was $229,900, up 3.0% from May, and up 2.2% from the Median Sales Price in June 2015. June is the 53rd consecutive month without a drop in price from the previous year.  In 2015, the monthly average of year-over-year price increase was 7.6%. The 2.2% rise in June appears to be signaling a moderation in price increases, which eases pressure on home affordability. Among the 53 metro areas surveyed in June, only four had a year-over-year drop in Median Sales Price. The remaining 49 metros reported higher prices than one year ago, with seven rising by double-digit percentages; Tampa, FL +14.1%, Orlando, FL +13.9%, Honolulu, HI +13.1%, Portland, OR +12.6%, Denver, CO +11.1% Boise, ID +10.1% and Augusta, ME +10.1%.
 
Days on Market – Average of 53 metro areas
The average Days on Market for all homes sold in June was 54, down 4 days from the average of 58 in both May 2016 and June 2015. June becomes the 39th consecutive month with a Days on Market average of 80 or less. In the three markets with the lowest inventory supply, Seattle, Denver and San Francisco, Days on Market was 25, 23 and 21 respectively. The highest Days on Market averages were seen in Augusta, ME at 143, down from 174 in May, and Des Moines, IA unchanged at 103. Days on Market is the number of days between when a home is first listed in an MLS and a sales contract is signed. 
 
Month’s Supply of Inventory – Average of 53 metro areas
The number of homes for sale in June was just 0.7% lower than in May, but 15.6% lower than in June 2015. Like May, June had a sequential inventory loss of less than 1%. The apparent stabilization of inventory on a month-to-month basis is a positive sign, especially during the summer selling season. Based on the rate of home sales in June, the Months Supply of Inventory was 3.2, which is nearly identical to last month and last year, 3.0 and 3.6 respectively. A 6.0 month supply indicates a market balanced equally between buyers and sellers. The number of metros with a Months Supply of Inventory below 2.0 may also be stabilizing at 8, down from 10 in May. The eight metros with less than a 2-month supply include Seattle, WA 1.2, Denver, CO 1.3, San Francisco, CA 1.3, Portland, OR 1.5, Boston, MA 1.5, Omaha, NE 1.8, Dallas-Ft. Worth, TX 1.9 and San Diego, CA 1.9 


Feel free to contact me and I can help break down exactly what these numbers mean for our local market and for your neighborhood.
And lastly, If you or anyone you know is thinking of buying or selling a home - please call or email me. I'm here to help!


And lastly, If you or anyone you know is thinking of buying or selling a home, please call or email me. I'm here to help!

Peter Veres

Associate Broker, CRS,ABR,CLHMS,SRES

Elite Asset Management Team"#1 RE/MAX Elite TeamRE/MAX Elite

www.PeteVeres.com

Cell: 505-362-2005

Office: 505-798-1000


JUNE 2016 RE/MAX NATIONAL MARKET UPDATE

by Elite Asset Management Team

Please click above for the National Market update.

Locally, the Albuquerque area housing market shows continued strength. With only 3,363 detached homes listed last month, the Albuquerque metro housing inventory continues to tighten, down 15.16 percent from May 2015. Absorption rates are down and look to be stable for now. If this trend continues we may start seeing home prices rise.

If you would like to view the local real estate market update please click here: May 2016 Greater Albuquerque Market Update

Feel free to contact me and I can help break down exactly what these numbers mean for our local market and for your neighborhood.

And lastly, If you or anyone you know is thinking of buying or selling a home, please call or email me. I'm here to help!

Peter Veres

Associate Broker, CRS,ABR,CLHMS,SRES

#1 RE/MAX Elite Team Agent - Albuquerque

RE/MAX Elite

www.PeteVeres.com

Cell: 505-362-2005

Office: 505-798-1000

May 2016 RE/MAX National Market Update

by Elite Asset Management Team

Homebuyer Demand Rises


The 2016 home-buying season has begun! We're continuing to see home demand rise even in the face of increased sales prices. While inventory remains much lower than last year, there are signs of stabilization month-to-month according to the May 2016 RE/MAX National Housing Report.
Feel free to contact me and I can help break down exactly what these numbers mean for our local market and for your neighborhood.
And lastly, If you or anyone you know is thinking of buying or selling a home - please call or email me. I'm here to help!
Thank you.
 
Rgds,
 
Pete
 
A. Peter Veres
Associate Broker, CRS,ABR,CLHMS,SRES
Elite Asset Management Team
"#1 RE/MAX Elite Team
RE/MAX Elite
www.PeteVeres.com
Cell:       505-362-2005
Office:    505-798-1000

The 2016 home-buying season has begun! We're continuing to see home demand rise even in the face of increased sales prices. While inventory remains much lower than last year, there are signs of stabilization month-to-month according to the May 2016 RE/MAX National Housing Report.


Feel free to contact me and I can help break down exactly what these numbers mean for our local market and for your neighborhood.
And lastly, If you or anyone you know is thinking of buying or selling a home - please call or email me. I'm here to help!


And lastly, If you or anyone you know is thinking of buying or selling a home, please call or email me. I'm here to help!

Peter Veres

Associate Broker, CRS,ABR,CLHMS,SRES

Elite Asset Management Team"#1 RE/MAX Elite TeamRE/MAX Elite

www.PeteVeres.com

Cell: 505-362-2005

Office: 505-798-1000


March 2016 RE/MAX National Market Update

by Elite Asset Management Team


Above you will the the National Housing Report from RE/MAX.

Pete Veres of RE/MAX Elite in Albuquerque, NM would like to share the latest Albuquerque Market update for March 2016. As the busy spring season approaches, the Greater Albuquerque housing market had a slight increase compared to March of last year with a seasonal jump compared to last month. The top selling price range was $200,000-$250,000. The 896 detached homes sold in March 2016 was an 8.34 percent increase over the same period in 2015 and a 40.44 percent increase from February’s sales of 638. Please click here to see the complete report. Albuquerque Market Update March 2016

Feb 2016 RE/MAX National Market Update

by Elite Asset Management Team


DENVER – Pete Veres wants to share the following National report from RE/MAX. As the popular home buying season approaches, February sales saw a jump from both January and last February. The year-over-year change was 4.8% and the increase over January was 5.8%, which is in line with the 5.2% average seen in each month of February since 2009.  Over the last 12 months, the average year-over-year increase in home sales has been 5.8%, and only two months, November and October, experienced sales that were not above year-ago sales. The Median Sales Price of all homes sold in February was $198,000 or 5.9% higher than the price in February 2015. Price increases have moderated over several months, with month-over-month declines seen in 6 of the last 12 months. The inventory of homes for sale remains very tight in many markets across the country, with February seeing a level that is 13.3% lower than a year ago. At the rate of home sales in February, the national Month’s Supply of inventory was 4.0, down from 4.7 in February 2015. In the local Albuquerque market we are seeing similar trends, the median price of $178,000 is up 5.33% from 2015 and our Feb 2016 active listings are down 15% as our inventory is also shrinking. To see the Feb 2015 Albuquerque Market summary please click here: Feb 2016 ABQ Market summary.
So far in 2016, January and February have both seen home sales at a pace higher than one year ago, and last year was one of the best our industry has seen in quite some time. Consumers are benefiting from price increases that have been moderating, but many will still be dealing with an inventory lower than we’d like to see. Serious homebuyers who choose to work with an experienced agent will have a much easier time navigating this market,” said Dave Liniger, RE/MAX CEO, Chairman of the Board and Co-Founder. 
 
“A lack of inventory continues to affect home values, as eager buyers compete for a small selection of homes. Home prices continue their long march back from the big price drops experienced in the financial crash. As more and more Americans gain equity, this increases the number of homeowners who are financially able to sell their home and buy another one. We’re seeing the benefits of this virtuous cycle in rising home prices, which are also being greatly aided by historically low mortgage rates,” added Bob Walters, Quicken Loans, Chief Economist.


DENVER – Pete Veres wants to share the following National report from RE/MAX. As the popular home buying season approaches, February sales saw a jump from both January and last February. The year-over-year change was 4.8% and the increase over January was 5.8%, which is in line with the 5.2% average seen in each month of February since 2009.  Over the last 12 months, the average year-over-year increase in home sales has been 5.8%, and only two months, November and October, experienced sales that were not above year-ago sales. The Median Sales Price of all homes sold in February was $198,000 or 5.9% higher than the price in February 2015. Price increases have moderated over several months, with month-over-month declines seen in 6 of the last 12 months. The inventory of homes for sale remains very tight in many markets across the country, with February seeing a level that is 13.3% lower than a year ago. At the rate of home sales in February, the national Month’s Supply of inventory was 4.0, down from 4.7 in February 2015. In the local Albuquerque market we are seeing similar trends, the median price of $178,000 is up 5.33% from 2015 and our Feb 2016 active listings are down 15% as our inventory is also shrinking. To see the Feb 2015 Albuquerque Market summary please click here: Feb 2016 ABQ Market summary.


So far in 2016, January and February have both seen home sales at a pace higher than one year ago, and last year was one of the best our industry has seen in quite some time. Consumers are benefiting from price increases that have been moderating, but many will still be dealing with an inventory lower than we’d like to see. Serious homebuyers who choose to work with an experienced agent will have a much easier time navigating this market,” said Dave Liniger, RE/MAX CEO, Chairman of the Board and Co-Founder.  

“A lack of inventory continues to affect home values, as eager buyers compete for a small selection of homes. Home prices continue their long march back from the big price drops experienced in the financial crash. As more and more Americans gain equity, this increases the number of homeowners who are financially able to sell their home and buy another one. We’re seeing the benefits of this virtuous cycle in rising home prices, which are also being greatly aided by historically low mortgage rates,” added Bob Walters, Quicken Loans, Chief Economist. 


Displaying blog entries 61-70 of 70

Syndication

Categories

Archives

Contact Information

Photo of Elite Asset Management  Real Estate
Elite Asset Management
RE/MAX SELECT
8300 Carmel Ave. NE Ste. 203
Albuquerque NM 87122
(505)362-2005

zillow reviews