Real Estate Information

Elite Asset Management Team's Blog

Elite Asset Management Team

Blog

Displaying blog entries 151-160 of 240

FEBRUARY 2017 RE/MAX NATIONAL MARKET UPDATE

by Elite Asset Management Team

Home Sales In January Set Record Pace


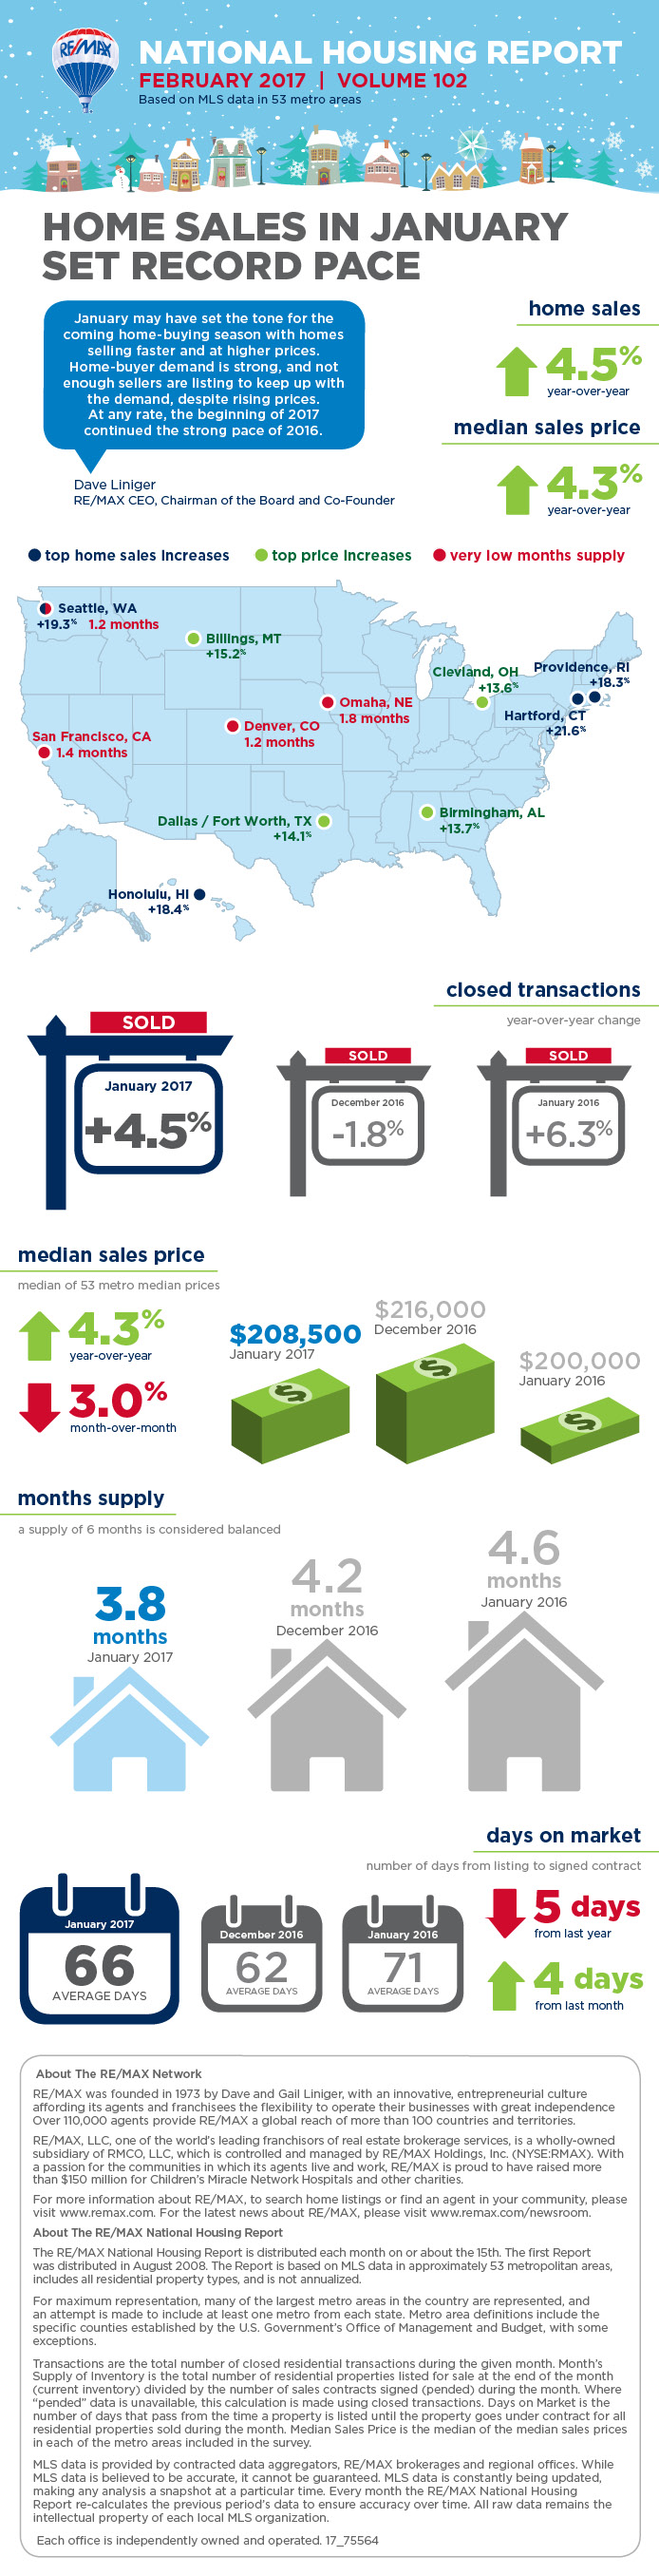
DENVER – With the tug-of-war between rising home sales and shrinking inventory intensifying, January set records for the RE/MAX National Housing Report. Last month topped all other Januarys in the report’s nine-year history with the most sales, highest sales price and fewest days on market.
 
In the 53 metro areas surveyed, total sales were up 4.5% over January 2016, which was previously the January with the most sales. The Median Sales Price of $208,500 was up 4.3% and marked the 10th consecutive month of year-over-year price increases.
 
The new January low of 66 Days on Market underscores the fact that inventory has declined year-over-year for 99 consecutive months dating back to October 2008.
 
“January may have set the tone for the coming home-buying season with homes selling faster and at higher prices,”said Dave Liniger, RE/MAX CEO, Chairman of the Board and Co-Founder. “Home-buyer demand is strong, and not enough sellers are listing to keep up with the demand, despite rising prices. At any rate, the beginning of 2017 continued the strong pace of 2016.”
 
Closed Transactions 
Of the 53 metro areas surveyed in January 2017, the overall average number of home sales increased 4.5% compared to January 2016. Over two-thirds of the 53 metro areas experienced an increase in sales year-over-year, with 12 experiencing double-digit increases.  The markets with the largest increase in sales included Hartford, CT +21.6%, Seattle, WA +19.3%, Honolulu, HI +18.4%, Providence, RI +18.3% and Charlotte, NC +18.1%.
 
Median Sales Price – Median of 53 metro median prices
In January 2017, the median of all 53 metro Median Sales Prices was $208,500, down 3.0% from December 2016 but up 4.3% from January 2016. Only five metro areas saw year-over-year decreases or remained unchanged, with 10 rising by double-digit percentages. The largest double-digit increases were seen in Billings, MT +15.2%, Dallas/Ft. Worth, TX +14.1%, Birmingham, AL +13.7%, Cleveland, OH +13.6% and Portland, OR +13.2%.
 
Days on Market – Average of 53 metro areas
The average Days on Market for homes sold in January 2017 was 66, up four days from the average in December 2016, but down five days from the January 2016 average. The three metro areas with the lowest Days on Market were Omaha, NE at 38 and Denver, CO and San Francisco, CA both at 39. The highest Days on Market averages were in Augusta, ME at 141 and Chicago, IL at 99. Days on Market is the number of days between when a home is first listed in an MLS and a sales contract is signed. 
 
Months Supply of Inventory – Average of 53 metro areas
The number of homes for sale in January 2017 was down 4.3% from December 2016, and down 16.9% from January 2016. Based on the rate of home sales in January, the Months Supply of Inventory was 3.8, compared to December 2016 at 4.2 and January 2016 at 4.6. A 6.0-month supply indicates a market balanced equally between buyers and sellers. In January, 46 of the 53 metro areas surveyed reported a months supply of less than 6.0, which is typically considered a seller’s market. The remaining seven saw a months supply above 6.0, which is typically considered a buyer’s market. The markets with the lowest Months Supply of Inventory continued to be in the west, with both Denver, CO and Seattle, WA at 1.2 and San Francisco, CA at 1.4.


Sandia Heights Stuff the Truck Event

by Elite Asset Management Team

Rising Home Prices Excellent News for Homeowners

by Elite Asset Management Team


Home prices have gone up recently and the reason behind it is that there are a lot more home buyers than homes that are on the market. You may be thinking that this isn’t a good thing, but it actually is.

What’s good about the increase in prices, according to CoreLogic’s US Economic Outlook, is that the average American home has gained equity over $11,000 over the course of last year. This is a national average. In Albuquerque our market average was 4.13% but the prices are area specific.

People are investing their new-found equity on themselves and on their home which is excellent. Investing it on their home is a lot better than spending it on depreciating assets.

This equity helps people put their kids through school, invest in business and even pay off their mortgages earlier.

It is predicted that home equity will appreciate by 5% next year.

Here are some stats for Albuquerque.

The average annual sales price for single-family detached homes rose 4.13% to $224,230

The median annual sales price for single-family detached homes grew 5.42% to $189,755

The number of attached and detached home sold jumped 7.65% to 11,764 transactions this year

Inventory of the 3,247 existing homes for sale is at its lowest level since May 2006

Here’s the complete Albuquerque 2016 Yearly Real Estate Summary:  2016 Market Report

If you are thinking of selling this may be a great time. First thing is to get a market analyisis to see how homes are priced in your area. Contact Pete Veres at 505-362-2005 for your free market analysis.


Track the Market: Get the latest market updates here: www.abqmarketinfo.com

With the free market snapshot, you’ll get real-time real estate updates sent directly to your email.


Albuquerque 2016 Yearly Real Estate Market Summary

by Elite Asset Management Team

The 2016 Market Statistics are in and we wanted to share those with you. Our market continues to show improvement. We are still seeing some excellent buying opportunities in some areas but inventory is dropping which means the market will start to favor sellers. Here are a few stats and if you would like the complete Albuquerque 2016 Yearly Real Estate Summary please click here: 2016 Market Report. In addition, if you would like to track the Homes for Sale, Homes Pending and Homes Sold in your Area go to www.AbqMarketinfo.com for your Free Market snapshot.

A Few Stats for the 2016 Greater Albuquerque area housing market:

The average annual sales price for single-family detached homes rose 4.13% to $224,230
The median annual sales price for single-family detached homes grew 5.42% to $189,755
The number of attached and detached home sold jumped 7.65% to 11,764 transactions this year
Inventory of the 3,247 existing homes for sale is at its lowest level since May 2006


Albuquerque Year End Residential Home Averages

by Elite Asset Management Team

The numbers are in for 2016. We saw a good year overall with the overall average market increase of 4.13% in residentail homes values, average home price up at $224,430. Our overall market inventory is dropping which is a good sign. We do need to remember that sales numbers are still very area specific. Most areas saw an incearse in the avergae home price but some are still adjusting. Please stay tuned for the specific area numbers coming soom. To track the price of home for sale, homes pending and homes sold in your area, go to www.AbqMarketinfo.com for your Free Market snaphot. Also feel free to call Pete Veres - Certified Residentail Specialist at 505-362-2005 for your specific questions.

Sandia Heights 2016 Market Summary

by Elite Asset Management Team

Pete Veres wanted to provide the Sandia Heights 2016 Market Summary. Sandia Heights is seeing improvement and if you would like the track the homes for sale, homes pending and homes sold, get your Free Market Snapshot by going to www.SandiaHomevalues.com If you would like a formal market analysis of your home please contact Pete at 505-362-2005.


JANUARY 2017 RE/MAX NATIONAL MARKET UPDATE

by Elite Asset Management Team

U.S. Home Sales Finish Strong in 2016


DENVER (Jan. 17, 2017) – Capped off by a strong December, 2016 was the best year for U.S. home sales since the recession, according to the January 2017 RE/MAX National Housing Report. Home sales in 2016 were the highest in the housing report’s eight-year history, topping the sales of 2015, the previously strongest year. Nine months of 2016 posted sales greater than in the same months of 2015.
 
According to the 53-market report, the trend of rising prices and shrinking inventory continued in December, even though December was one of the three months that trailed 2015, with sales 1.8% below December 2015. Even so, nearly half of the markets reported increased sales over December 2015, and almost two-thirds saw sales higher than November 2016. The median increase over November 2016 was 1.7%.
 
The median sales price of $216,000 was 4.9% above one year ago and only 1.8% below November’s.
 
Inventory declined 17.9% year-over-year in December, continuing a year-long streak of double-digit declines. Months Supply of Inventory was 4.2, with 47 markets below the 6 months normally considered a balanced market.
 
The average Days on Market of 62 was the lowest of any December in the report’s history.
 
“Much like 2015, we saw a mostly healthy housing market in 2016 that posted steady growth in sales and prices,” said Dave Liniger, RE/MAX CEO, Chairman of the Board and Co-Founder. “We’re back to pre-recession levels in many markets, with 2017 forecast to be another solid year. We’ll have to wait and see what impact rising interest rates will have.”
 
Closed Transactions 
Of the 53 metro areas surveyed in December, the overall average number of home sales fell 1.8% compared to December 2015. But nearly half of the 53 metro areas experienced an increase in sales year-over-year, with three experiencing double-digit increases.  The markets with the largest increase in sales included Wilmington/Dover, DE +21.4%, Honolulu, HI +19.7%, Augusta, ME +16.1%, Las Vegas, NV +7.9% and Providence, RI +7.3%.
 
Median Sales Price – Median of 53 metro median prices
In December, the median of all 53 metro Median Sales Prices was $216,000, down 1.8% from November but up 4.9% from December 2015. Of the 53 metro areas surveyed, all but two (Des Moines, IA and New Orleans, LA) saw year-over-year increases or remained unchanged with nine rising by double-digit percentages. The largest double-digit increases were seen in Birmingham, AL +17.1%, Tampa, FL +16.8%, Charlotte, NC +13.2%, Seattle, WA 12.9% and Orlando, FL +12.3%.
 
Days on Market – Average of 53 metro areas
The average Days on Market for homes sold in December was 62, up three days from the average in November 2016, but down five days from the December 2015 average. The two metro areas with the lowest Days on Market were Omaha, NE and Denver, CO both at 36. The highest Days on Market averages continued to be in Augusta, ME at 141, and Burlington, VT at 101. Days on Market is the number of days between when a home is first listed in an MLS and a sales contract is signed. 
 
Months Supply of Inventory – Average of 53 metro areas
The number of homes for sale in December was down 14.0% from November, and down 17.9% from December 2015. Based on the rate of home sales in December, the Months Supply of Inventory was 4.2, compared to November at 4.0 and December 2015 at 4.9. A 6.0-month supply indicates a market balanced equally between buyers and sellers. In December, 47 of the 53 metro areas surveyed reported a months supply of less than 6.0, which is typically considered a seller’s market. One reported a balanced market at 6.0, while the remaining five saw a months supply above 6.0, which is typically considered a buyer’s market. The markets with the lowest Months Supply of Inventory continued to be in the West, with San Francisco, CA at 1.2, Seattle, WA at 1.5 and Denver, CO at 1.6.

ABQ’s Housing Market Trends Remain Positive in Off-Season

by Elite Asset Management Team

Albuquerque, NM  (December 12, 2016) – The Greater Albuquerque housing market has remained consistent throughout 2016.  In year-over-year comparisons, the number of homes for sale has dropped in most Central New Mexico communities while homes sold faster and for higher prices. The housing market improvements in Albuquerque have occurred with enough regularity and time to make it a trend for the entirety of 2016.

The 798 detached homes sold in November 2016 marked an 18.2 percent increase over the same period last year, and the 79 attached homes sold represented a 23.4 percent increase over 2015. Pending sales are also up 25.7 percent for detached homes and 34.3 percent for townhomes and condos, indicating that the market is not slowing down much for the market’s typical cold-weather off-season.

While the total inventory of homes for sale in the Albuquerque metro market was down again to 18.8 percent compared to the same period last year, the 979 detached homes newly-listed for sale in November represented only a 6.4 percent year-over-year decrease. Newly-listed townhomes and condos increased by 5.7 percent compared to November 2015.

The median sales price in the metro area increased 2.8 percent to $185,000 for detached homes and increased by 23.8 percent to $151,000 for townhomes and condos. The average sales price for detached homes increased by 2.7 percent to $218,795 as the average price for townhomes and condos jumped 21.4 percent to $164,526.

“Financial markets were volatile in the days surrounding the presidential election,” said Jon Schnoor, 2016 President of the Greater Albuquerque Association of Realtors. “The market has since self-corrected and reached new heights. Long-term indicators of what it will be like to have a real estate developer for a President remains unclear. Prior to the election, a national shift in housing trends was hard to come by, and unemployment rates have not budged since August 2015.” He also noted, “Post-election, mortgage rates are up and opinions in the industry are that a national, and possibly local, trend shift is likely in the near future.”

To see the full Great Albuquerque Market report for November 2016, Click Here.

DECEMBER 2016 RE/MAX NATIONAL MARKET UPDATE

by Elite Asset Management Team
November Home Sales Defy Seasonal Trend
DENVER (Dec. 16, 2016) – Despite the typical winter slowdown, November home sales finished 19.1% above a year ago and prices increased 1.4% over October. All but one of the 53 markets in the RE/MAX National Housing Report posted an increased number of sales over November 2015, with nearly half of the markets at least 20% higher. In all, last month saw more homes sold than any other November in the eight-year history of the report.
 
With one month to go, 2016 is on pace to exceed what was a strong 2015. Year-over-year, 2016 has posted price increases or stayed flat in all 11 months to date, and sales increases in nine months. November posted the largest percentage year-over-year sales increase thus far in 2016.
 
Last month, the Median Sales Price among the 53 markets edged above October at $220,000 and finished 8.9% higher than November 2015. As in the first 10 months of 2016, inventory continued to drop year-over-year, with a decline of 17.0%.
 
November’s Months Supply of Inventory was 4.0, compared to the 5.0 months supply reported in November 2015. Days On Market averaged 59, compared to 58 in October and 65 a year ago. 

The continued decline of inventory and talk of rising interest rates may have contributed to November’s surge of home sales,” said Dave Liniger, RE/MAX CEO, Chairman of the Board and Co-Founder. Over the past 11 months, the majority of markets have seen home prices return to their pre-recession levels, reaffirming that 2016 has been the best year for the housing market since the recession.”
 
Closed Transactions 
Of the 53 metro areas surveyed in November, the average number of home sales increased 19.1% compared to one year ago, which marks the second highest increase in the eight-year history of the report. This month, only one of the 53 metro areas surveyed experienced a decrease in sales year-over-year (Miami, FL at -11.4%) while the remaining 52 saw increases.  The markets with the largest increase in sales include Billings, MT +38.1%, Las Vegas, NV +34.9%, Boise, ID +33.1%, Burlington, VT +30.7%, Honolulu, HI +30.3% and Phoenix, AZ, +29.1%.
 
Median Sales Price – Median of 53 metro median prices
In November, the median of all 53 metro Median Sales Prices was $220,000, up 1.4% from last month and up 8.9% from November 2015. Of the 53 metro areas surveyed, all but two (Burlington, VT and Des Moines, IA) saw year-over-year increases with respect to Median Sales Price, 15 rising by double-digit percentages. The largest double-digit increases were seen in Honolulu, HI +17.7%, Tampa, FL +15.9%, Dallas/Ft. Worth, TX +15.0%, Seattle, WA +13.2% and Birmingham, AL +13.1%.

Days on Market – Average of 53 metro areas
The average Days on Market for homes sold in November was 59, up one day from the average in October 2016, but down six days from this time last year. The two metro areas with the lowest Days on Market are San Francisco and Denver at 32 and 33 respectively. The highest Days on Market averages continue to be in Augusta, ME at 148, and Burlington, VT at 97. Days on Market is the number of days between when a home is first listed in an MLS and a sales contract is signed. 
 
Months Supply of Inventory – Average of 53 metro areas
The number of homes for sale in November was down 9.3% from October, and down 17.0% from November 2015. Based on the rate of home sales in November, the Months Supply of Inventory was 4.0, compared to last month at 3.9 and last year at 5.0. A 6.0-month supply indicates a market balanced equally between buyers and sellers. In November, 49 of the 53 metro areas surveyed reported a months supply of less than 6.0, which is typically considered a seller’s market. The remaining four reported a months supply above 6.0 which is typically considered a buyers market. The markets with the lowest Months Supply of Inventory continue to be San Francisco, CA at 1.3, Denver, CO at 1.5 and Seattle, WA 1.6, with Denver and Seattle seeing the same Months Supply of Inventory as last month.


6 Reasons Why Autumn is the Best Time to Buy a Home

by Elite Asset Management Team

With warm temperatures and long days, Summer has traditionally been the high season for buying real estate. But as the infographic below shows, advantages for buyers crop up when temperatures fall.


Displaying blog entries 151-160 of 240

Syndication

Categories

Archives

Contact Information

Photo of Elite Asset Management  Real Estate
Elite Asset Management
RE/MAX SELECT
8300 Carmel Ave. NE Ste. 203
Albuquerque NM 87122
(505)362-2005

zillow reviews