Real Estate Information

Elite Asset Management Team's Blog

Elite Asset Management Team

Blog

Displaying blog entries 141-150 of 240

MAY 2017 RE/MAX NATIONAL MARKET UPDATE

by Elite Asset Management Team

April Home Sales Cooler Than Typical Spring Season


DENVER – The brisk start to the 2017 home-selling season slowed down in April with home sales dropping 4.1% below March and 4.5% below the previous April, according to this month’s RE/MAX National Housing Report.
 
Yet the narrative of the ever-tightening inventory coupled with increased prices persisted, as the 53 metro area report saw the trends of a seller’s market continuing:
       -The average number of Days on Market declined for the third consecutive month and April’s 57 days set a new low for April in the report’s nine-year history.
       -The Median Sales Price of $226,000 was the highest price for any April and marked the 13th consecutive month of year-over-year price increases.
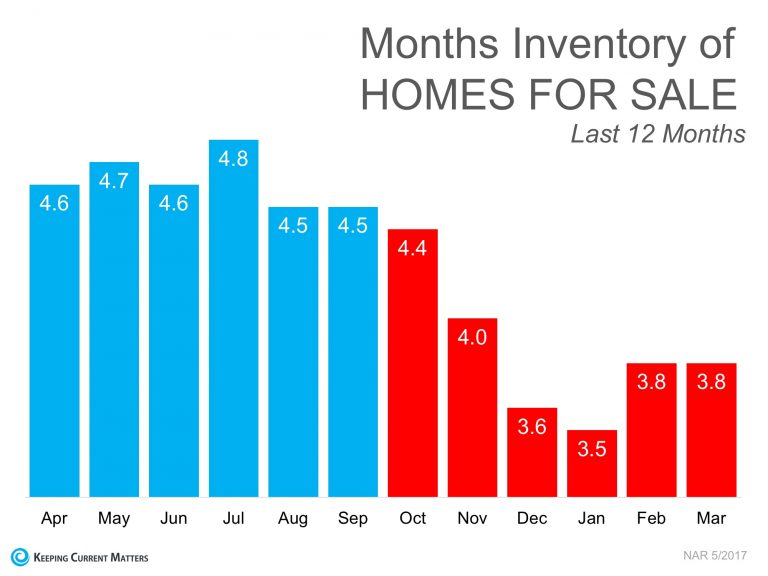
       -Months Supply of Inventory, which dropped below 3 months in March for the first time in the report’s history, was 2.8. A months supply of less than 6.0 is considered a seller’s market.
       -Inventory was down 17.6% from April 2016. This is the 102nd consecutive month of year-over-year declines dating back to October 2008.

More than three quarters of the report’s 53 metro areas saw April home sales decline year-over-year. By contrast, March posted a 6.6% year-over-year spike in sales. Even so, April saw homes sell for more than they did in March in 81% of the markets, while 92% of the markets saw higher year-over-year sale prices.
 
“We may be seeing some frustration from buyers,” said Dave Liniger, RE/MAX CEO, Chairman of the Board and Co-Founder“Inventory is tighter than ever, while strong demand keeps driving up home prices. At the same time, many potential sellers may also be reluctant to list their homes because the tight inventory might impact them as buyers. Home buyers and sellers will need to work with experienced real estate agents to navigate this tough market.”
 
Closed Transactions 
Of the 53 metro areas surveyed in April 2017, the overall average number of home sales decreased 4.5% compared to April 2016. Forty-three of the 53 metro areas experienced a decrease in sales year-over-year or remained unchanged. Ten markets saw an increase in sales, including Wilmington/Dover, DE +13.8%, Fargo, ND +5.7%, Trenton, NJ +5.0%, Phoenix, AZ +4.3% and Houston, TX +2.3%.
 
Median Sales Price – Median of 53 metro median prices
In April 2017, the median of all 53 metro Median Sales Prices was $226,000, up 0.44% from March 2017 and up 5.2% from April 2016. Only four metro areas saw year-over-year price decreases, with 10 rising by double-digit percentages. The largest double-digit increases were seen in Seattle, WA +13.9%, Dallas/Ft. Worth, TX +12.5%, Charlotte, NC +12.2%, Miami, FL +12.0% and Orlando, FL +11.7%.
 
Days on Market – Average of 53 metro areas
The average Days on Market for homes sold in April 2017 was 57, down seven days from the average in March 2017, and down seven days from the April 2016 average. The four metro areas with the lowest Days on Market were San Francisco, CA at 22, Denver, CO at 25, Seattle, WA at 26 and Omaha, NE at 27. The highest Days on Market averages were in Augusta, ME at 148 and New York, NY at 96. Days on Market is the number of days between when a home is first listed in an MLS and a sales contract is signed. 
 
Months Supply of Inventory – Average of 53 metro areas
The number of homes for sale in April 2017 was down 1.3% from March 2017, and down 17.6% from April 2016. Based on the rate of home sales in April, the Months Supply of Inventory was 2.8, compared to March 2017 at 2.7 and April 2016 at 3.2. This is the second month in a row months supply has been below 3.0. A 6.0-months supply indicates a market balanced equally between buyers and sellers. In April 2017, 51 of the 53 metro areas surveyed reported a months supply of less than 6.0, which is typically considered a seller’s market. At 6.5, Burlington, VT and at 6.4, Miami, FL were the only two metro areas that saw a months supply above 6.0, which is typically considered a buyer’s market. The markets with the lowest Months Supply of Inventory continued to be in the west, with Seattle, WA remaining at 0.9 for the second month in a row, Denver, CO remaining at 1.0 for the third month in a row and San Francisco, CA at 1.1.

Why Real Estate Is the Top Pick of Americans for Long Term Investment

by Elite Asset Management Team

Gallup conducts a survey every year which asks Americans which long term investment they prefer. The choices are real estate, savings accounts, bonds, gold or stocks/mutual funds.

The number one choice for long term investment based on the survey is real estate at 34% and it’s been the top answer for 4 straight years. It is followed by stocks at 26%. Pete Veres, local Real Estate Investment Specialist states “ Real Estate continues to be one of the best long term investments. Look at guys like Trump and Buffet”

Here’s the full report:


The study aims to show the contrast of the sentiment over the last 4 years as compared to the 2011-2012 survey, which shows gold taking the top spot. This was the time of the recovery from the recession.

With the recovery of the real estate market, people have grown confident and have seen the potential of a long term investment in real estate.  

The only problem is that most people don’t understand how to properly invest in real estate and set it up in a way that others pay for your investment. Contact a specialist like Pete Veres with RE/MAX so he can explain how real estate investing works.

Pete Veres, CRS – Elite Asset Mgt. Team RE/MAX Elite 505-362-2005 email: [email protected]

PMI... What You Need To Know

by Elite Asset Management Team


There are a large number of mortgage programs available to buyers that allow them to purchase a home with a down payment below 20%.  Knowing the facts is crucial for a stress free home buying experience and here are some about Private Mortgage Insurance (PMI).


According to Freddie Mac, PMI is:

An insurance policy that protects the lender if you are unable to pay your mortgage. It's a monthly fee, rolled into your mortgage payment,  that is required for all conforming, conventional loans that have down payments less than 20%.


Once you've built equity of 20% in your home, you can cancel your PMI and remove that expense from your mortgage payment.”


The monthly premiums are paid by the borrower, and the lender is the beneficiary.

Freddie Mac also states that:

 “The cost of PMI varies based on your loan-to-value ratio – the amount you owe on your mortgage compared to its value – and credit score, but you can expect to pay between $30 and $70 per month for every $100,000 borrowed.”


Down payment for homes last year for all buyers was at 10%. It dropped to 6% for first-time home buyers.  For repeat buyers it was at 14%. From this data, it seems that buyers were not fazed by PMI and were able to buy the home they wanted.


Example of the cost of a mortgage on a $200,000 home with a 5% down payment & PMI, compared to a 20% down payment without PMI:


Larger Down Payment = Low Monthly Housing Cost


“It's no doubt an added cost, but it's enabling you to buy now and begin building equity versus waiting 5 to 10 years to build enough savings for a 20% down payment.” – says Freddie Mac

“The other thing you need to remember that home prices are going up so by the time you save up enough down payment it could cost you much more to buy the home including higher monthly payment and even perhaps higher interest rates.” says Pete Veres – RE/MAX

It’s best to meet with a professional like Pete Veres – Certified Residential Specialist who can help you make a decision whether to hold off on buying and save up for a bigger down payment or purchase now while the market is hot.

“One last thing to remember is that as home values go and your principal goes down your PMI may only be around for a few years.” Pete Veres –RE/MAX

Pete Veres – Elite Asset Management Team RE/MAX Elite 505-362-2005 email: [email protected].


WHY YOU SHOULD LIST YOUR HOME TODAY BASED ON THESE STATS

by Elite Asset Management Team

The inventory of homes for sales, according to the National Association of Realtors (NAR), is at 3.8-month supply, which is quite low compared to the normal market which has about a 6 month supply. In Albuquerque we are at 3.1 months down from 4.3 in April 2016.

Buyer traffic, which is the report of the NAR on the number of buyers looking for homes each month. March saw a huge amount of home buyers in 45 of the 50 states. A lot of buyers are now having a difficult time finding a home to buy because of the competitive market. They can’t get into their dream home because they have to compete with other buyers. We are also starting to see this in Albuquerque at price points under $200,000.00

This is what they call a Seller’s market. This is a great time to list your home because you can capitalize on the on-going situation. With the inventory of homes being low, you will have the upper hand when it comes to pricing your home. One thing to remember is pricing is based upon the comps in your local area and price range and can very.

According to CoreLogic’s latest Equity Report, 78.9% of homeowners have more than 20% equity in their homes. Fannie May made a study and only 37% of homeowners believe that they have more than 20% equity. If you would like a quick online valuation go to www.ABQPrice.com . Please note that these numbers are only estimates. This low confidence in homeowners leads them to under value their home equity and not sell their homes thus causing the low inventory.

If you are unsure about selling your home, the best thing to do is to meet with your realtor who can help you evaluate your home equity and give you options and all the information you need about the market and guide you to where you want to be. Pete Veres, Certified Residential Specialist has over 25 years of real  estate experience and can provide you with a free sellers consultation.  If you would like to see what homes are selling for in your area check out www.AbqMarketinfo.com

Thinking of buying an Investment Property? Here is some important information.

by Elite Asset Management Team

Simply put, an Investment Property is a property that a homeowner uses to generate income and build equity. A second home, on the other hand, is a property where a homeowner lives for a part of the year. So, if you’re using the property to make a profit then it would be considered as an investment property.

Here are some examples of investment properties:

A home that is being rented

A vacation home by a resort area, beach, golf area or ski area

A property that your fix-up and flip

If you’re going to finance an investment property be ready for higher interest rates and larger down payments due to a higher risk for the lender. For flips cash is a great options.

You can get traditional financing on an investment property but it would need to be an owner occupant, that you would have to buy a multi-unit or an apartment building and live in one unit (year-round-living). You should be able to finance the property the conventional way with low rates and low down payment. 

Pete Veres has over 25 years of real estate investment experience and says that real estate is one of the best ways to build wealth. There are so many ways to do this, for example you can even buy, flip and hold properties in a Self-directed IRA ( make sure you consult with a specialist), set up cash flow properties and even do an Airbnb. For example if you own a rental the tenant pays down your loan and over time you will increase your equity. Contact Pete 505-362-2005 to discuss what option would work best for you. 

APRIL 2017 RE/MAX NATIONAL MARKET UPDATE

by Elite Asset Management Team

Strong March Home Sales, Low Inventory Means Tougher Market for Buyers


DENVER – March launched the home-buying season with post-recession records for increasing home sales and prices and decreasing inventory, according to this month’s RE/MAX National Housing Report that surveys 53 metro areas.
 
Last month, home sales were 6.6% higher than the nine-year-old report’s previous March record, set in 2016. Thirty-eight of the 53 metro areas in the report showed year-over-year increases.
 
Meanwhile, Months Supply of Inventory dropped below three months for the first time in the history of the report, indicating a market that greatly favors sellers, as six months is considered a balanced market.
 
Active inventory continued to decline, dropping 17% year-over-year. As a result, the Median Sales Price of $225,000—also a March record—was up 11% year-over-year. This was the 12th consecutive month of year-over-year price increases.
 
Homes continued selling faster last month, with the average Days on Market dropping to 64, compared to 68 in February 2017 and 71 in March 2016. 
 
“We expect a seasonal uptick in sales this time of year and March certainly met and somewhat exceeded that expectation,” said Dave Liniger, RE/MAX CEO, Chairman of the Board and Co-Founder“We don’t anticipate the tightening inventory to ease up in most markets until new home construction can catch up to its pre-recession pace. Until then, sellers will enjoy a fast-paced market and buyers will need to work with their agents to get in the right home.”
 
Closed Transactions 

Of the 53 metro areas surveyed in March 2017, the overall average number of home sales increased 6.6% compared to March 2016. Of the 53 metro areas, 38 experienced an increase in sales year-over-year, with 16 experiencing double-digit increases.  The markets with the largest increase in sales included Richmond, VA +23.3%, Wilmington/Dover, DE +22.6%, Trenton, NJ +19.7%, Las Vegas, NV +15.3% and Chicago, IL +14.8%.
 
Median Sales Price – Median of 53 metro median prices
In March 2017, the median of all 53 metro Median Sales Prices was $225,000, up 7.1% from February 2017 and up 11.0% from March 2016. Only four metro areas saw year-over-year decreases, with 15 rising by double-digit percentages. The largest double-digit increases were seen in Manchester, NH +15.9%, Orlando, FL +13.7%, Charlotte, NC +13.3%, Trenton, NJ +12.8% and Nashville, TN +12.8%.
 
Days on Market – Average of 53 metro areas
The average Days on Market for homes sold in March 2017 was 64, down four days from the average in February 2017, and down seven days from the March 2016 average. The three metro areas with the lowest Days on Market were San Francisco, CA and Omaha, NE both at 27 and Denver, CO at 32. The highest Days on Market averages were in Augusta, ME at 159 and Burlington, VT at 118. Days on Market is the number of days between when a home is first listed in an MLS and a sales contract is signed. 
 
Months Supply of Inventory – Average of 53 metro areas
The number of homes for sale in March 2017 was up 1.2% from February 2017, but down 17.0% from March 2016. Based on the rate of home sales in March, the Months Supply of Inventory was 2.7, compared to February 2017 at 3.6 and March 2016 at 3.2. This is the first time in the history of the RE/MAX National Housing Report that months supply has hit below 3.0. A 6.0-month supply indicates a market balanced equally between buyers and sellers. In March 2017, 52 of the 53 metro areas surveyed reported a months supply of less than 6.0, which is typically considered a seller’s market. At 6.3, Burlington, VT was the only metro area to see a months supply above 6.0, which is typically considered a buyer’s market. The markets with the lowest Months Supply of Inventory continued to be in the west, with Seattle, WA at 0.9, San Francisco, CA and Denver, CO both at 1.0.

When most homeowners are thinking of selling their home just want to get sold.  Of course, selling it for the right price and have the home selling process flow smoothly is also important.

If you want your home sold with the best possible price, have smooth transaction and with minimum effort on your part then you should consider using a real estate professional. They have the experience and knowledge which gets results. They also have all the proper forms you will need and are on top of all the currents rules and regulations which do change.

The internet is changing rapidly the real estate industry. According to the National Association of Realtors’ 2016 Profile of Home Buyers & Sellers, people who use the internet to search for homes have increased by 94%. But that doesn’t mean that you can just post your property online and have it sell immediately.

The same report revealed that 96% of buyers who use the internet to search for homes, searched for agent or broker websites such as www.SearchAbqArea.com or from websites by home builders. Only 2% of buyers bought homes directly from sellers whom they didn’t know which could be risky and costly.

When buyers look for homes online they also rely on realtor to find a home for them and set up showings (47%). They also depend on realtors to negotiate the price (36%) and the terms of sale (47%).  The home selling process is one of the most important things a home seller should understand. And that’s why 61% of home buyers use a professional real estate agent. Here is a great site to check out some of the latest seller’s tips, www.abqsellertips.com

The real estate industry is evolving every year with the help of technology. Having a real estate professional guide you and help you sell your home can make all the difference. They have connections, knowledge, experience and the drive to get you what you want. If you are looking for a very good local agent check out www.TopABQAgent.com

MARCH 2017 RE/MAX NATIONAL MARKET UPDATE

by Elite Asset Management Team

Home Prices at New High in February Amid Record Low Inventory


DENVER – February home prices reached a new high as steady demand combined with record low inventory drove prices up, according to this month’s RE/MAX National Housing Report that surveys 53 metro areas.
 
Last month saw a negligible decline (-0.02%) in home sales from February 2016, which posted the most sales in the nine-year history of the report. Less than half of the markets experienced an increase in sales year-over-year.
 
Meanwhile, active inventory reached a record low for February, dropping 17.9% year-over-year. This marks the 100th consecutive month of year-over-year declines dating back to October 2008.
 
As a result, the Median Sales Price of $212,000 – another February record – was up 6% year-over-year. This is the 11th consecutive month of year-over-year price increases.
 
Homes sold faster last month, with average Days on Market dropping from 75 in February 2016 to 68 last month. 
 
“Inventory, not the rise in interest rates, remains the principal constraint on home sales,” said Dave Liniger, RE/MAX CEO, Chairman of the Board and Co-Founder“The resale market is driven dramatically by the availability of new homes. Most U.S. markets have a high demand for new home construction, and although it’s good to see housing starts trending upward, we still need more.”
 
Closed Transactions 
Of the 53 metro areas surveyed in February 2017, the overall average number of home sales decreased 0.02% compared to February 2016. Of the 53 metro areas, 23 experienced an increase in sales year-over-year, with nine experiencing double-digit increases.  The markets with the largest increase in sales included Trenton, NJ +26.2%, Nashville, TN +19.4%, Las Vegas, NV +18.2%, Wichita, KS +14.6% and Birmingham, AL +13.3%.
 
Median Sales Price – Median of 53 metro median prices
In February 2017, the median of all 53 metro Median Sales Prices was $212,000, up 1.4% from January 2017 and up 6.0% from February 2016. Only six metro areas saw year-over-year decreases or remained unchanged, with 16 rising by double-digit percentages. The largest double-digit increases were seen in Fargo, ND +19.9%, Burlington, VT +18.4%, Tampa, FL +15.9%, Indianapolis +14.3% and Dallas/Ft. Worth, TX +13.9%.

Days on Market – Average of 53 metro areas
The average Days on Market for homes sold in February 2017 was 68, up two days from the average in January 2017, but down seven days from the February 2016 average. The three metro areas with the lowest Days on Market were San Francisco, CA at 32, Omaha, NE at 34 and Denver, CO at 38. The highest Days on Market averages were in Augusta, ME at 147 and Chicago, IL at 109. Days on Market is the number of days between when a home is first listed in an MLS and a sales contract is signed. 
 
Months Supply of Inventory – Average of 53 metro areas
The number of homes for sale in February 2017 was down 2.2% from January 2017, and down 17.9% from February 2016. Based on the rate of home sales in February, the Months Supply of Inventory was 3.6, compared to January 2017 at 3.8 and February 2016 at 4.0. A 6.0-month supply indicates a market balanced equally between buyers and sellers. In February 2017, 45 of the 53 metro areas surveyed reported a months supply of less than 6.0, which is typically considered a seller’s market. The remaining eight saw a months supply above 6.0, which is typically considered a buyer’s market. The markets with the lowest Months Supply of Inventory continued to be in the west, with both Denver, CO and Seattle, WA at 1.0 and San Francisco, CA at 1.1.

Seniors - SRES Market Place March Newsletter

by Elite Asset Management Team

Pete Veres wants to share this month’s Seniors SRES- newsletter. Topics include: Housing Challenges Ahead for Exploding Senior Population & What not to say to care givers. Click here: SRES March Newsletter Please contact your local Seniors Real Estate Specialist if you or any family or friends need any help with your real estate need. Here to help and serve.


What will the market look like this year?

by Elite Asset Management Team

We’re a few months into the year and many potential buyers and sellers are wondering, is this a good year to get into the market? Many current homeowners are thinking about the value of their homes, even if they’re not thinking of listing anytime soon.

The information I’m sending this month provides an overview of what’s in store for the American real estate market this year based on expert predictions and current price and sales data. Please click here to view: What will the market look like this year? These forecasts provide insight into current trends and paint a picture of what may happen this year. Please note that this is an overall update of the national market, local and regional factors may play a role in specific forecasts for our market.

If you’d like to know more about our local market, want to know how much your home is worth or are thinking of buying or selling, give me a call. I’d love to discuss the market with you and assist you with all of your real estate needs.


Displaying blog entries 141-150 of 240

Syndication

Categories

Archives

Contact Information

Photo of Elite Asset Management  Real Estate
Elite Asset Management
RE/MAX SELECT
8300 Carmel Ave. NE Ste. 203
Albuquerque NM 87122
(505)362-2005

zillow reviews