December 2017 RE/MAX National Housing Report
Sales Up Despite Years of Rising Prices, Falling Inventory
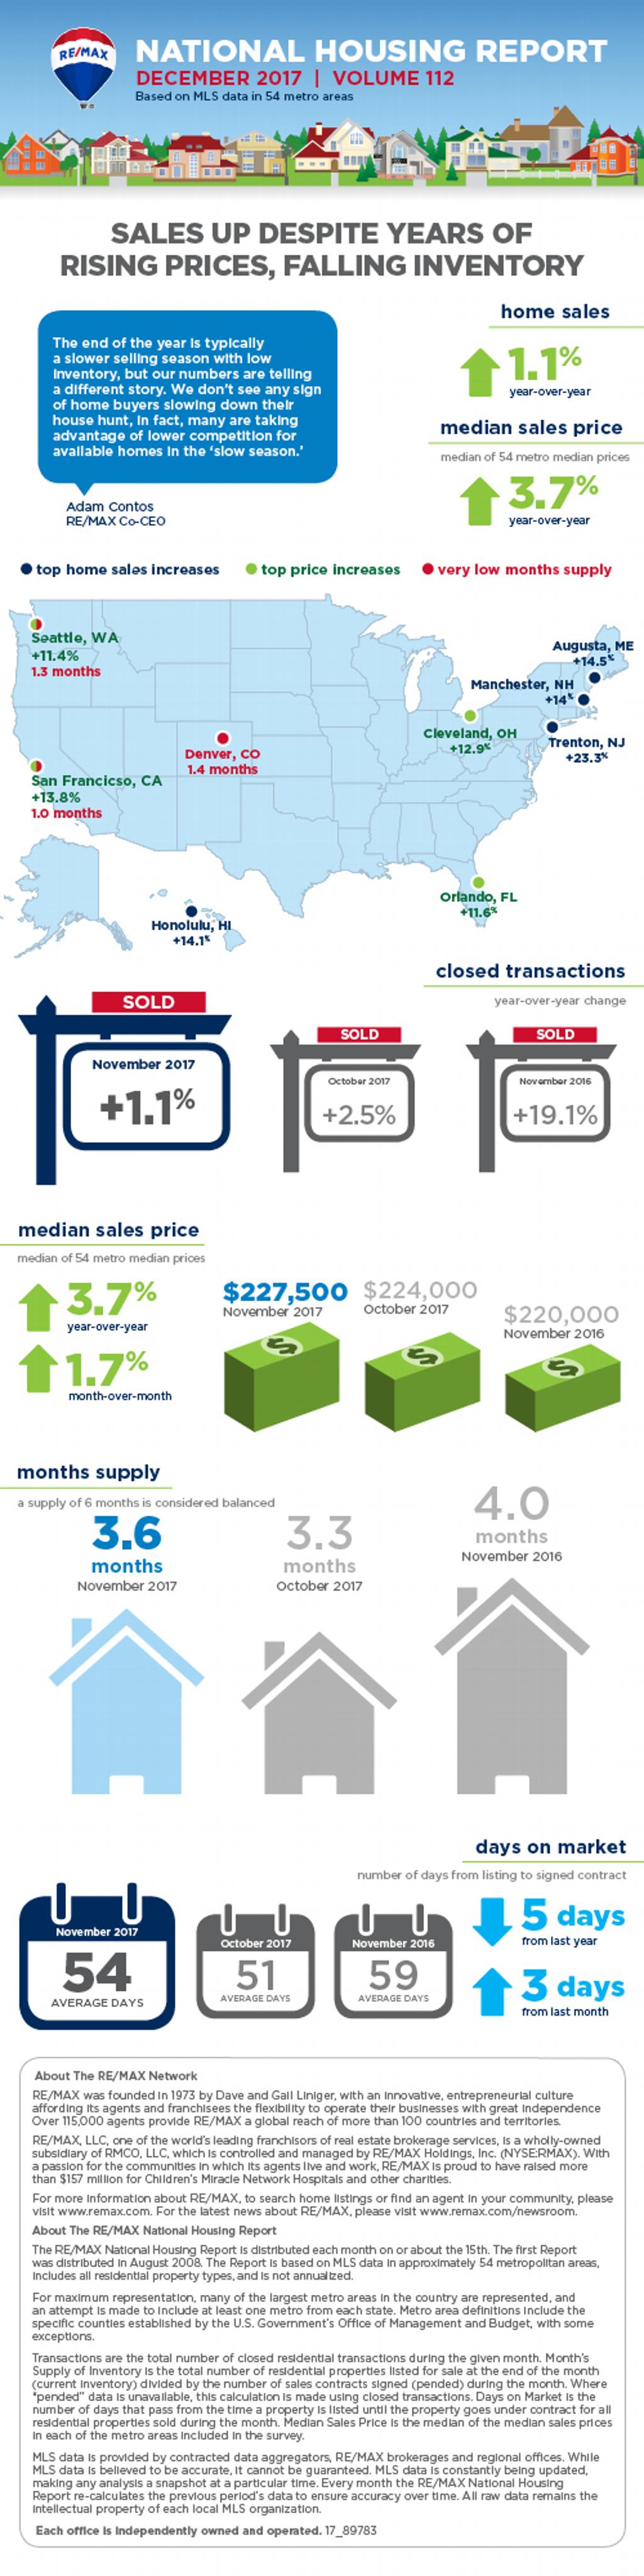
DENVER - November became the sixth month of 2017 to post an increase in year-over-year home sales, bucking prolonged trends of home price increases and inventory declines, according to the December RE/MAX National Housing Report.
The sales increase of 1.1% came on the strength of increased transaction closings in 36 of the report’s 54 markets. At the same time, buyers felt increasing headwinds as the Median Sales Price rose to $227,500 and marked the 20th consecutive month of year-over-year home price increases. In fact, the Median Sales Price has increased year-over-year in 69 of the last 70 months dating back to February 2012.
November's inventory decline of 14.5% extended the streak of consecutive months of fewer homes on the market to 108. The current streak started nine years ago, in November 2008, shortly after the RE/MAX National Housing Report was introduced.
Setting new report lows for November were Days on Market at 54 and Months Supply of Inventory at 3.6
“The end of the year is typically a slower selling season with low inventory, but our numbers are telling a different story,” said Adam Contos, RE/MAX Co-CEO. “We don’t see any sign of home buyers slowing down their house hunting. In fact, many are taking advantage of lower competition for available homes in the ‘slow season.’”
Contos added that, while consumer confidence is up and unemployment remains low, new home starts continue to lag because of material costs and a labor shortage. “Until we begin to see new homes being built, we won’t see much growth in available homes on the market,” he said.
Closed Transactions
Of the 54 metro areas surveyed in November 2017, the overall average number of home sales decreased 7.3% compared to October 2017 but increased 1.1% compared to November 2016. Thirty-six of the 54 metro areas experienced an increase in sales year-over-year, including Trenton, NJ, +21.3%, Augusta, ME, +14.5%, Honolulu, HI, +14.1%, and Manchester, NH, +14.0%.
Median Sales Price – Median of 54 metro median prices
In November 2017, the median of all 54 metro Median Sales Prices was $227,500, up 1.7% from October 2017 and up 3.7% from November 2016. Only five metro areas saw a year-over-year decrease in Median Sales Price, including Anchorage, AK, -5.3%, Trenton, NJ, -4.2%, and Honolulu, HI, -3.4%. Nine metro areas increased year-over-year by double-digit percentages, with the largest increases seen in San Francisco, CA, +13.8%, Cleveland, OH, +12.9%, Orlando, FL, +11.6%, and Seattle, WA, +11.4%.
Days on Market – Average of 54 metro areas
The average Days on Market for homes sold in November 2017 was 54, up three days from the average in October 2017, and down five days from the November 2016 average. The four metro areas with the lowest Days on Market were San Francisco, CA, at 25, Omaha, NE, at 27, Seattle, WA, at 29, and Nashville, TN, at 30. The highest Days on Market averages were in Augusta, ME, at 116, and Miami, FL, at 86. Days on Market is the number of days between when a home is first listed in an MLS and a sales contract is signed.
Months Supply of Inventory – Average of 54 metro areas
The number of homes for sale in November 2017 was down 9.2% from October 2017, and down 14.5% from November 2016. Based on the rate of home sales in November, the Months Supply of Inventory increased to 3.6 from 3.3 in October 2017, but decreased compared to the 4.0 of November 2016. A 6 months supply indicates a market balanced equally between buyers and sellers. In November 2017, 49 of the 54 metro areas surveyed reported a months supply at or less than 6, which is typically considered a seller’s market. The metro areas that saw a months supply above 6.0, typically considered a buyer’s market, were Augusta, ME, at 8.4, Miami, FL, at 7.6, and Fargo, ND, at 6.5. The markets with the lowest Months Supply of Inventory continued to be in the West, with San Francisco, CA, at 1.0, Seattle, WA, at 1.3, and Denver, CO, at 1.4.
Feel free to contact me and I can help break down exactly what these numbers mean for our local market and for your neighborhood.
And lastly, If you or anyone you know is thinking of buying or selling a home - please call or email me. I'm here to help!
Peter Veres
Associate Broker, CRS,ABR,CLHMS,SRES
Elite Asset Management Team - RE/MAX Elite
Cell: 505-362-2005
Office: 505-798-1000